


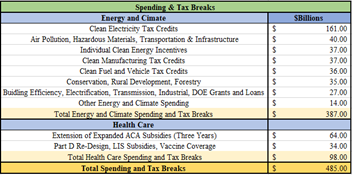
Equity and bond market investors have a very busy week ahead of them after giving thanks with friends and family this past week. The Federal Reserve also has its work cut out for them on the inflation front. Unfortunately, a lackadaisical Fed Reserve has let inflation go on a wild turkey run. The latest Consumer Price Index (CPI) reading for October 2022 came in at a roasting annual increase of 7.7%. As usual whenever inflation is an issue, it’s typically driven largely by the necessities of human existence. Energy prices increased most of the CPI measurements at 17.6% followed by food increases of 10.9%.
According to the University of Illinois, 46 million turkeys are eaten each Thanksgiving. The American Farm Bureau Federation estimated that the average cost of this year’s Thanksgiving holiday meal for ten people increased 20% to $64.05 from the 2021 average of $53.31. America’s collective Thanksgiving spending increased more than $225 million for just the turkey and not counting side dishes (46 million times $4.97 AFB price increase for turkey). U.S. Secretary of Agriculture Tom Vilsack had previously warned all Americans of a large turkey shortage. Free-market Austrian economists chortled that Secretary Vilsack had neglected to count the docile turkeys at the Federal Reserve and in leadership in the executive and legislative branches of the Federal government.
All kidding continued, let’s talk turkey about inflation. The greatest economic uncertainty and focus for investors seems to be whether the Federal Reserve gaggle is succeeding in reining in inflation or not. Stock market bulls are feeling a little more confident that the Federal Reserve is moving closer to ending its tightening program after “minutes” from the November policy meeting showed “most” of the Fed herd favored slowing the pace of interest rate hikes “soon.” According to the Fed minutes, some turkeys even warned that continued rapid monetary policy tightening increased the risk of instability or dislocations in the financial system.
Most Wall Street experts predict the central bank clucks will raise the benchmark rate by 50-basis points at its upcoming December 13-14 meeting following four consecutive 75-basis point hikes. The most important inflation updates this coming week will be the PCI Prices Index on Thursday and the November Employment Situation on Friday. Investors are also anxious to hear Top Cockster Jerome Powell discuss the US economic outlook during an appearance at the Brookings Institute on Wednesday afternoon. Powell recently crowed that the Fed could shift to smaller rate hikes next month, but, like all two-handed economists, also squawked that rates may need to go higher than policymakers thought would be needed by next year. Stock market bears maintain that the more important issue is how high rates will ultimately need to go and how long the Fed will hold them there. All of which is of course dependent on how fast inflation comes down. This is the key question being debated among economists, business leaders, investment advisors, and investors.
For their part, the Fed members generally see inflation coming home to roost rather quickly. The range of Fed member projections from their last dot plot exercise in September, 2022 are as follows – 2022 (5.0% to 6.2%), 2023 (2.4% to 4.1%), and 2024 (2.0% to 3.0%). This Federal Reserve has lost an incredible amount of market credibility by being stubbornly beholden to its “inflation is transitory” mantra in 2021. It’s prudent for all economic actors, particularly low- and middle-income consumers and workers who arguably suffer the greatest hardships during inflationary periods, to at least consider that the turkeys at the Fed are once again being too optimistic on inflationary trends. If the moral sense of the global working-class population is that inflation is a secular trend, it may likely become a secular trend. Look for striking workers and protesting citizenry in the U.S. and globally.
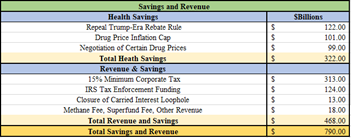
I believe it was Founding Father Patrick Henry of “Give me liberty or give me death!” fame that also counseled, “I have but one lamp by which my feet are guided, and that is the lamp of experience. I know no way of judging the future but by the past.” Thankfully, the investment professionals at Research Affiliates (RA) have examined inflationary eras of the past in their recent article, “History Lessons: How “Transitory” Is Inflation?” RA examined a meta-analysis of 67 published studies on global inflation and monetary policies. Their key conclusions from their study were as follows:
- The US Federal Reserve Bank’s expectation for the speed of reverting to 2% inflation levels remains dangerously optimistic.
- An inflation jump to 4% is often temporary, but when inflation crosses 8%, it proceeds to higher levels over 70% of the time.
- Reverting to 3% inflation, which we view as the upper bound for benign inflation, is easy from 4%, hard from 6%, and very hard from 8% or more. Above 8%, reverting to 3% usually takes 6 to 20 years, with the median of over 10 years.
- Those who expect inflation to fall rapidly in the coming year may well be correct. But history suggests that’s a “best quintile” outcome. Few acknowledge the “worst quintile” possibility in which inflation remains elevated for a decade. Our work suggests that both tails are equally likely, at about 20% odds for each.
As Fed Chair Jerome Powell remembers well because he lived it, the last secular inflationary episode in the United States was in the 1970s and 1980s. If Shakespeare is right that “What’s past is prologue,” here is a summary of the return performance of various major asset classes in the 20-year inflationary period from 1970 (CPI breached 6% in 1969) to 1986 (CPI declines to 1%) to illuminate the darkness of an unknown investment future.
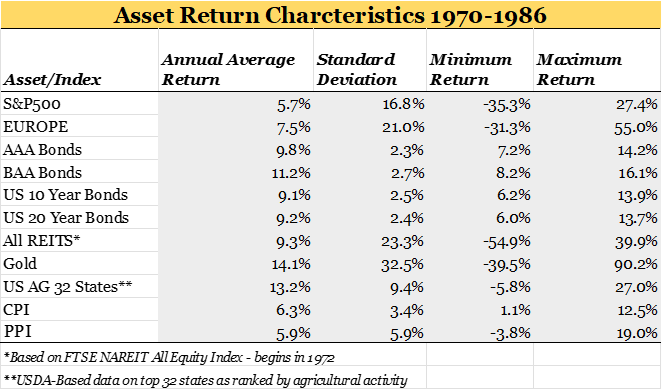
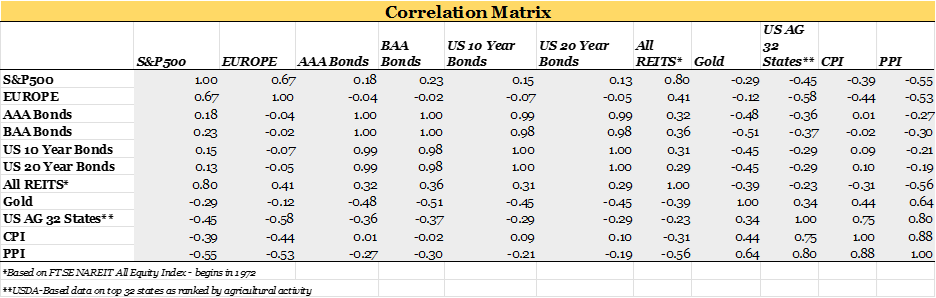
Source: Data complementary of the TIAA Center for Farmland Research
The best risk-adjusted return profiles from this secular inflationary period were high quality fixed income instruments of varying maturities and farmland. Note that farmland and bonds were negatively correlated over this period so may complement each other rather nicely in a portfolio positioned for secular inflation. REITs and gold provided similar annual returns but at much higher levels of volatility/standard deviation.

In bowling, three strikes in a row is called a turkey. In economic parlance, that’s the triptophanic effect of the sleepy leadership at the Federal Reserve and in the executive and legislative branches of the Federal government.

 Clear signs of an impending Fed policy mistake would lead us to aggressively consider a tactical allocation to commodities through PDBC. One low-probability scenario would be a significant dislocation or lack of market liquidity in the U.S. Treasury market that forces the Fed to purchase treasuries. The Fed would effectively be adopting yield curve controls, much like the recent
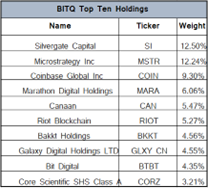
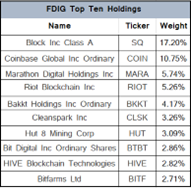
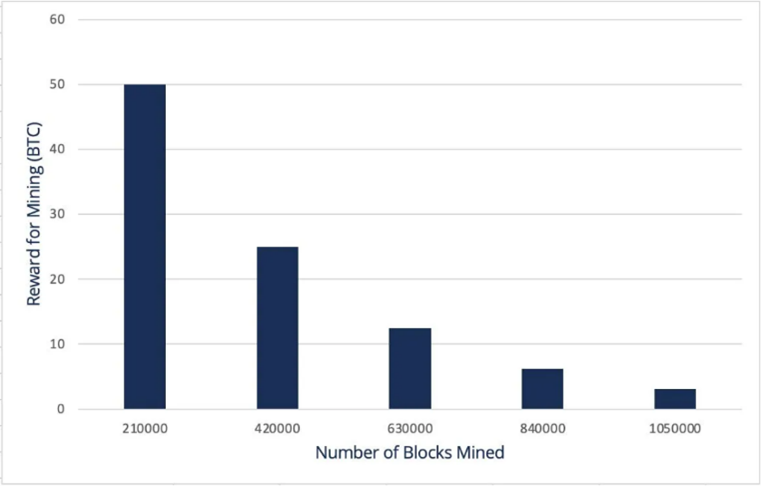 About every four years or 210,000 blocks verified, the Bitcoin reward for solving a block is halved. This rate was established at inception to limit the supply growth and cap the total number of Bitcoins that will ever exist at
  Fourteen years later, it is hard to imagine Satoshi had any idea that his creation would become such a big deal with some countries even using