
Introduction
Since March of 2022, the Federal Reserve has lifted its benchmark interest rate 11 times and held rates steady only twice at its regularly scheduled meetings, including this past September’s pause. With the Federal Reserve’s interest rate hiking campaign seemingly nearing an end at a 22 year high for the Federal Funds Rate of 5.25% to 5.50%, we thought we’d take a fresh look at the Real Estate Investment Trusts (REITs) sector. REITs have become a more common investment choice for investors looking to diversify their portfolios from traditional 60%/40% stock and bond portfolios. A REIT is a company that owns or operates real estate. The real estate owned ranges widely from office buildings, shopping malls, and hotels to warehouses, data centers, and storage facilities. REITs are attractive to investors because they provide efficient and liquid access to real estate investing without requiring actual ownership or management of real estate properties. REIT companies allow investors to purchase minority interests in their real estate portfolios and essentially hire the executive team and employees to manage the properties on their behalf. REIT investors typically receive consistent and strong dividend payments, share price appreciation, tax benefits, and a hedge against inflation. REITs can avoid double taxation through dividend-paid deductions. REIT companies are required to distribute at least 90% of their taxable income to shareholders through dividends for the REIT to avoid corporate-level taxation. This structure allows investors to receive real estate income without the burden of double taxation. In other words, REIT investors should receive higher dividend distributions than under a corporate-level taxation regime.
Types of REITs
REITs come in various types and specialize in many different types of properties. According to NAREIT data, the predominant categories of REITs today include Infrastructure and Industrial, Residential, Retail, Healthcare, and Office.
The chart below summarizes the comparative REIT components from 2000 and May of last year and highlights the changes in the largest real estate asset classes over time:
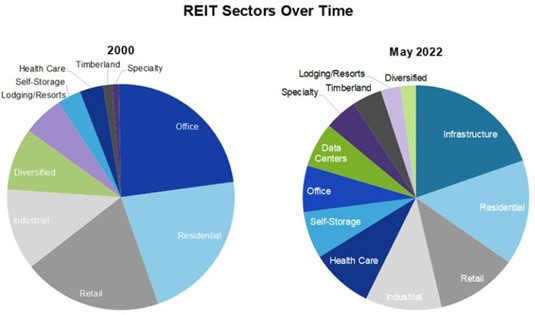
Source: National Association of Real Estate Investment Trusts (NAREIT)
Infrastructure and Industrial: Infrastructure REITs own and manage infrastructure real estate and collect rent from tenants that occupy that real estate. Infrastructure REITs’ property types include fiber cables, wireless infrastructure, telecommunications towers, and energy pipelines. Industrial REITs own and manage industrial facilities and rent space in those properties to tenants. Some industrial REITs focus on specific types of properties, such as warehouses and distribution centers. Industrial REITs play an important part in e-commerce and are helping to meet the rapid delivery demand. We’ve grouped these together since one type is essential a network for transferring information while the other is a network for transferring goods. These REIT sectors are a growing part of today’s modern economy.
Residential: Residential REITs or Multifamily REITs invest in manufactured housing and apartment buildings. They both offer affordable alternatives to home ownership which satisfies a seemingly never-ending demand for younger Americans just entering the workforce. Affordable housing is another non-discretionary item and there will always be a base level of demand. Residential REITs succeed the most when they invest in areas where home costs are too expensive or impractical and centrally located apartments are in high demand. Cities such as Chicago and New York are prime residential REIT investment examples. If there is consistent demand for apartments over homeownership, Residential REITs will find success.
Retail: Retail REITs invest in shopping malls, strip malls, and other retail outlets. Revenue is received from monthly rent payments from retail tenants. This leasing aspect makes it important for Retail REITs to try and pick optimal store tenant mix and locations that maximize the amount of foot traffic to their retail properties. Amazon is making it increasingly difficult for most traditional retail department stores to remain profitable and in business. Think of Sears and K-mart. Retail REITs need to invest wisely in properties and tenants that are less impacted by online shopping. This includes high-traffic areas such as urban malls, popular tourist shopping areas, and necessity-based or non-discretionary stores for frequent recurring purchases (convenience stores, pharmacies, grocery stores, etc.). Areas that REIT companies tend to shy away from are areas with high vacancy rates, lack of accessibility either pedestrian or car traffic, and areas of economic decline and high crime rates. For example, Target made headlines this past week with their announcement to close nine stores across four states because of theft and crime. The Minneapolis-based company will close locations in the Harlem neighborhood of New York City, Seattle, Portland and the San Francisco Bay Area effective Oct. 21.
Healthcare: Healthcare REITs invest in hospitals, clinics, retirement homes, and skilled nursing facilities. Again, given favorable U.S. demographics, particularly an aging Baby-Boomer generation, there is going to be consistent demand for healthcare services which brings stability and success for Healthcare REITs that own the real estate assets leased to retirement home and skilled nursing providers. Increased demand for healthcare, such as with the COVID-19 pandemic, may lead to better performance for Healthcare REITs with variable rent components based on sales. In addition, life expectancies continue to increase which means the older population keeps growing. Since older people require more healthcare and nursing/retirement home services, there is an overall increase in demand for healthcare which has boosted the performance of Healthcare REITs in recent years.
Office: Office REITs invest in office buildings and collect monthly rental income from tenants. These tenants are generally businesses and companies with centrally located offices to drive employee collaboration. As more and more companies are introducing remote work environments, office vacancy rates have increased in recent years which has put significant pressure on the Office REIT sector. Office vacancy rates have climbed across all of the major U.S. cities, led by San Francisco’s increased vacancy rate of nearly 20%. The Visual Capitalist stated that it is anticipated that by 2030, over 300 million square feet of U.S. office spaces will be obsolete. Other factors such as the unemployment rate and economic performance can also directly affect the performance of Office REITs.
REIT Yields and Comparison to Farmland
REITs have traditionally provided investors with consistent dividend income and appreciation potential. The amount and variability of rental income depends on the type of REIT and the overall sector performance at the given time. We’ve tried to highlight the differences in REIT income sources above between those that a predominantly non-discretionary in nature like Residential REITs and those REITs with higher variability in rental streams like Office and Retail REITs.
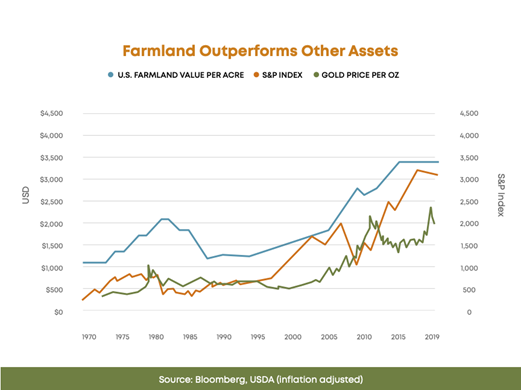
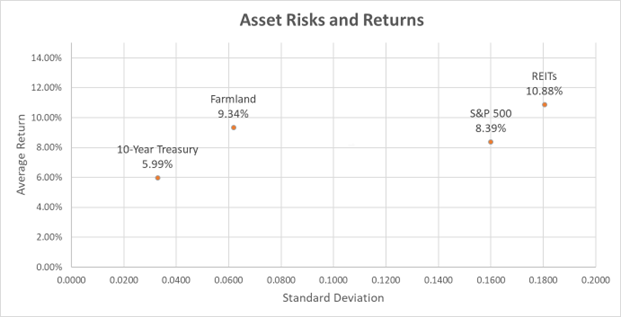
Using data compiled from the TIAA Center for Farmland Research, we’ve compiled performance data below for REITs, farmland, 10-year U.S. treasury, and the S&P 500 for the last nearly 50-year period (since 1975). REITs (averaged from all types) average annual total return of 10.88% per year while farmland provided an average annual return of 9.34% nationally. While REITs offered the highest annualized return over this period, it was also the most volatile of the four assets as measured by the standard deviation of its returns at 18%. REIT volatility surpassed the S&P 500 of 16%. Farmland outperformed all of the other asset classes on a risk-adjusted basis with its annual return of 9.34% but with only a third of the volatility of REITs at 6%.
The performance of most REIT sectors are more variable than farmland depending on economic factors such as interest rate fluctuations and supply and demand changes. REITs are considered an interest rate sensitive asset class much like the utility sector. For example, the largest REIT ETF is Vanguard REIT Index (VNQ). VNQ’s year-to-date returns through August 2023 are measly 1.9% total return with a one-year annualized loss of -7.3% and two-year loss of -9.7%. On the other hand, farmland has generally continued to appreciate in 2022 and 2023 based on the favorable trends in farming income. Farmland stability comes from the constant need for food and the fact that it’s uncorrelated with other asset classes, but highly correlated with inflation as measured by the Consumer Price Index (CPI).
Source: https://farmland.illinois.edu/research-briefs/
As the chart depict below, REITs have still given farmland a run for their money albeit with more volatility producing a value of $68k for $1k investment in 1975. Farmland was a close second at $67k outcome for your $1k. However, the stability of farmland returns is noticeable from the chart. Farmland generates income from agricultural activities which have relatively lower capital expenditures and income potential compared to income-generating properties like multifamily apartments or commercial office buildings. REITs will have much more capital expenditures for repair and maintenance of building structures whereas farms are mostly land with farm structures generally approximating 5% to 10% of the value of the farmland. Investors generally require higher yields from REITs because of the higher Capex requirements and the higher risk of obsolescence. Think Office REITs and some Retail locations and business models. In theory, investors should therefor require a lower risk premium for farmland given its lower volatility as compared to REITs, but there is limited available data to support this assertion.
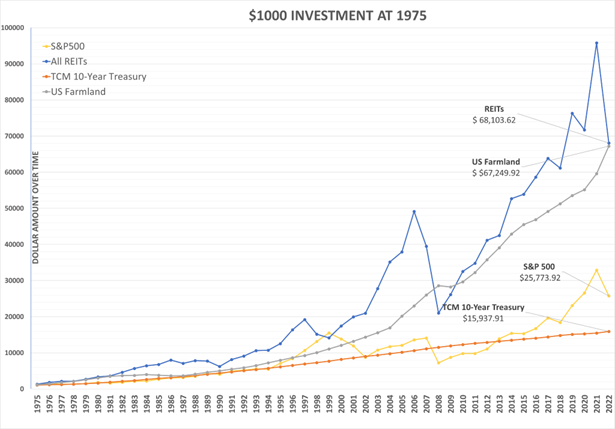
This graph shows the growth of a $1000 investment in 1975 over time. If you invested $1000 into each of these 4 asset classes, you would get the most return out of REITs and farmland.
Source: https://farmland.illinois.edu/research-briefs/
The State of REITs
Servant Financial’s institutional investment research partner SpringTide Partners recently conducted a review of state of interest rate sensitive real estate sector considering the Fed’s hike spike in interest rates. SpringTide examined REITs, midstream energy, and S&P 500 earnings yields (E/P, or cap rate) to 2-year and 10-year U.S. Treasury yields. Below is a chart of the spread between these earnings yields and the 2-year treasuries. You’ll note that for REITs the current yield spread is roughly -2.5%. This spread to 2-years hasn’t been this negative previously until just prior to the 2008-9 global recessionary period and the Global Financial Crisis. In that era of Fed policy mismanagement, REITs yield spreads blew out almost 7.5 percentage points from -2.5% in 2007 to just shy of 5.0% in 2009. This graph also demonstrates the yield spread of REITs compared to other asset yields. You’ll also note that yield spread to 10-year treasuries and S&P 500 is also negative for the first time since 2007. In other words, investors are not receiving a risk premium over 2-year treasuries for investing in either REITs, long-term treasuries (no term premium), and S&P 500. This analysis suggests investors would currently be better off putting money into a savings account rather than REITs, 10-year treasuries, or the S&P 500.
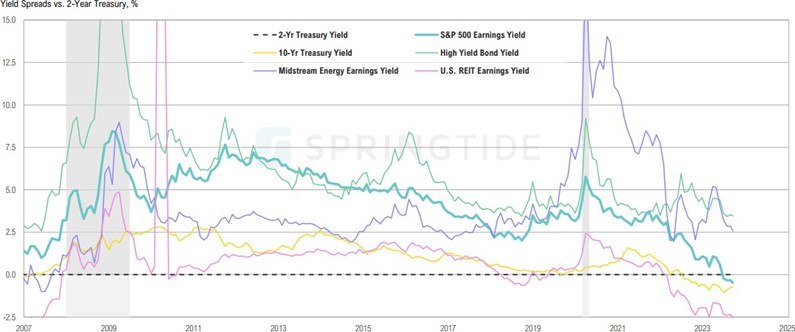
Source: https://springtide-partners.com/
This chart below demonstrates that the historical entry/purchase cap rates for REITs are a key determinant of an investor’s exit net multiples. The cap rate is computed as the net operating income of a REIT divided by the purchase price at time of entry. Higher cap rates suggest higher risk at the time of purchase and increased risk premiums relative to risk-free treasuries. REITs today are trading at 6.4% cap rate, or earnings yield. According to this chart, investors who buy REITs at the current 6.4% cap rate would be lucky to break even much like where the 2015-post-COVID cycle investors who bought in. Alternatively, the historical sweet spot to invest in REITs was in the early 1990s and the pre- and post-Dot.com bust of the late 1990s and early 2000s when entry cap rates were roughly 9.5% compared to today’s 6.4%.
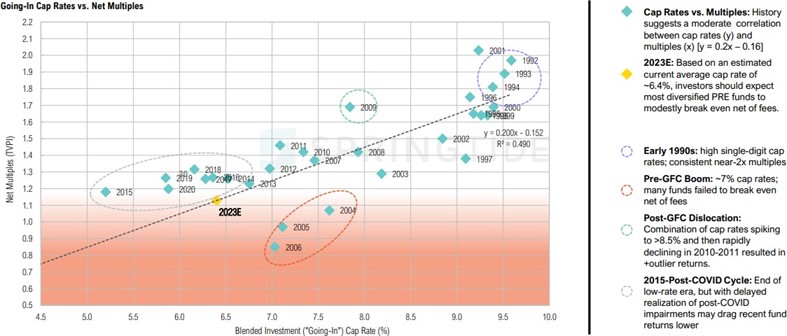
Source: https://springtide-partners.com/
Conclusion
REITs have gained popularity amongst investors for their portfolio diversification benefits. They offer exposure to a range of real estate sectors and risk profiles, such as retail, residential, healthcare, office, and infrastructure/industrial. While REITs have provided historically attractive average annual returns since 1975, other investment options, such as short-term U.S. treasuries, money market funds, farmland, or high-yield bonds, look more attractive on a risk-adjusted basis in our current economic state. High-interest rates are drastically affecting the performance of REITs, particularly those REITs with higher leverage, interest rate risk, and near-term refinancing exposures. Our recommendation is that REIT investors remain patient and await the Fed’s “hike spike” to work its way into REIT entry cap rates. Based upon recent history, a move in REIT yield spreas over 2-year treasuries of 2.5% to 5.0% seems “real”-istic.