

Author’s Note
“This past month, I defended my master’s thesis on the Role of Farmland in a Mixed Asset Investment Portfolio. Under the direction of Dr. Bruce Sherrick at the University of Illinois at Urbana-Champaign, I explored how an investment in farmland can interact in an investment portfolio of equities, bonds, and treasuries in addition to how it can hedge against inflation. Using data maintained by Dr. Sherrick and courtesy of the TIAA Center for Farmland Research, I analyzed the returns to farmland from 1970-2020 and some of my results are discussed below in addition to introducing farmland as an asset class to institutional and individual investors.” – Ailie
Background on US Farmland
Farmland is a unique asset class in that it has a limited supply and potentially an unlimited useful life. Only 17.2% of the United States landmass is considered arable. With a growing world population projected to reach 9.7 billion by the year 2050, farmland is well positioned as a production source for a basic human need: food. Not only is the population rising but income levels are also expected to follow suit with world GDP projected to double by 2050. These statistics suggest that demand for food is going to go up and the composition of caloric intake is expected to change. Research shows that protein consumption rises with rising income levels. With a significant portion of farmland acres dedicated to either feeding livestock or producing other protein sources like chickpeas or lentils, farmland owners and operators are uniquely positioned to meet this demand and profit from it. So long as humanity needs food, there will be economic rewards for the cultivators and landowners.
Farm Balance Sheet
If an institutional or individual investor was investing in a company’s common stock or buying a corporate bond, they would typically examine the balance sheet of the company. The same is true for investing in farmland. Farmland has grown in value significantly over the last 50 years with a 55% increase in the last 10 years alone. Farmland (Real Estate in the table below) dominated the asset side of the farm sector’s balance sheet encompassing close to 83% of total assets. Under the recent low-interest-rate environment, farmland’s debt level has also grown but this is still significantly less than the portion of farm assets it supports. The overall low debt to equity ratio of 16.2% demonstrates a very conservative leverage position relative to other real asset sectors and the relative strength of the U.S. Agriculture industry as a whole.
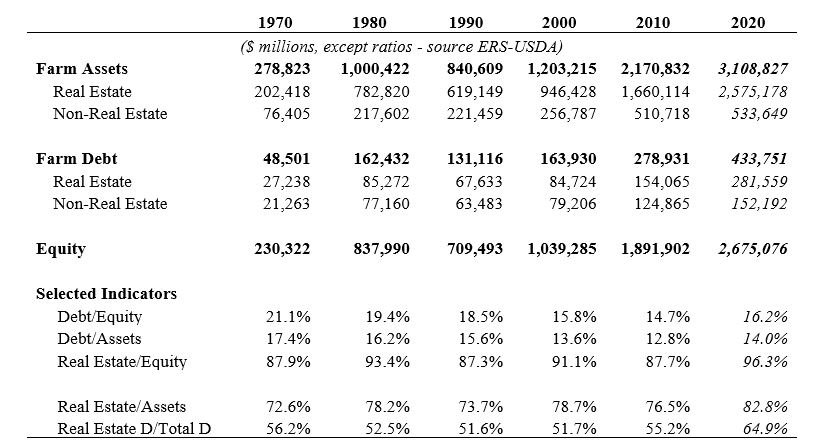
Data maintained by the TIAA Center for Farmland Research based on data from the Economic Research Service, a sector of the USDA
Returns to Farmland
Like any real estate asset, farmland receives returns when held by an investor in two ways: appreciation in value and cash flow generated from rental income. In 2021, the U.S has experienced a rise in both. According to the USDA, farmland prices are up 8% from last year. Record sales prices of farmland have been occurring throughout the U. S.’s key growing regions.
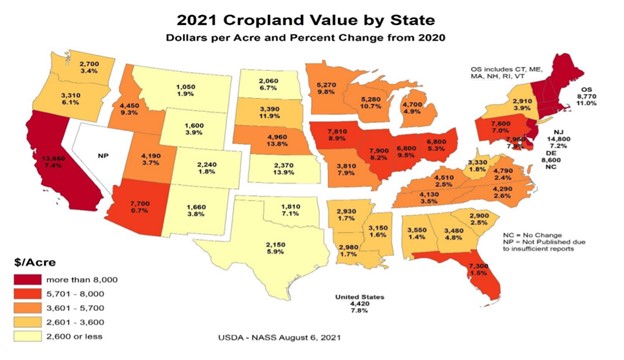
August 2021 USDA Land Values Summary
On the rental income side, most investors would be participating in a straight cash rent system meaning a farmer pays the landowner a fixed amount per year for the use of the land. Recently, the U.S. has experienced growth in cash rent values along with the rise in farmland prices. Fueled by strong commodity prices, healthy farming profits, and appreciating land value, cash rental rates are projected to rise 10% in 2022.
To examine a longer-term horizon of historical returns to farmland, data from the TIAA Center for Farmland Research was utilized from the years 1970-2020. During this period, the average return to all U.S farmland was 9.7% with a standard deviation of 6.4%. This composite return encompasses all 50 states. However, not all regions of the U.S. are suitable for farming or have optimal productivity. An institutional investor also has to consider that that are nine anti-corporate farming states that would make it difficult for them to invest in certain key production states like Iowa.
One way for an investor to maximize their potential returns while gaining operational efficiencies from scale is to invest in a farmland fund that provides broad diversification with farms in several key states. The Promised Land Opportunity Zone Fund (“PLOZ” or “Promised Land”) is one way for investors to capitalize on the durable returns of U.S. farmland while also receiving favorable tax benefits such as a reduced capital gain taxes depending on how long the asset is held. The government defines opportunity zones as urban and rural communities that need significant investment to foster economic revitalization. The current PLOZ portfolio is managed by Farmland Partners in conjunction with Servant Financials’ founder, John Heneghan. Currently Promised Land owns 10 properties of 8,000 acres in North Carolina, South Carolina, Illinois, and Mississippi. These states encompass some of the highest performing states in the U.S.
Using this state composite for Promised Land, the weighted average return of states represented in the fund can be used as a proxy to compare farmland returns with other traditional investments. This is done by weighting the allocation to each of the 5 states by purchase price then finding the average return of these states using the TIAA Center for Farmland Research’s data on cropland return. The return from 1970-2021 across the Promised Land proxy states was 11.1% with a standard deviation of 8.4%. Looking at the more recent term, this farmland proxy had a return of 8.2% with a lower standard deviation of 5.2%.
Note: This analysis uses USDA state-level averages to compare historical returns and does not necessarily represent the returns that an investor would achieve with an allocation to the Promised Land Opportunity Zone Fund.
Relationship of Farmland with Traditional Investments
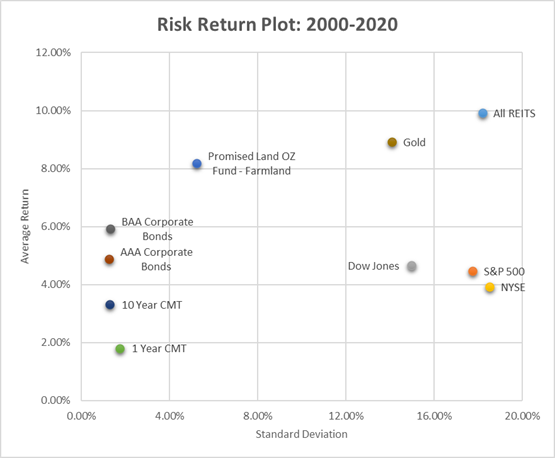
The proxy returns in the Promised Land Opportunity Zone Fund can be compared with other traditional assets such as corporate bonds, stock indices, REITS (real estate investment trusts), treasuries, and gold. Using a risk-return plot under two different time horizons, the position of farmland as an investment can be compared with other investments. Performance metrics from 1970-2020 were examined to show farmland as a longer-term investment compared to a shorter time horizon of 2000-2020. See the figures below for full details.
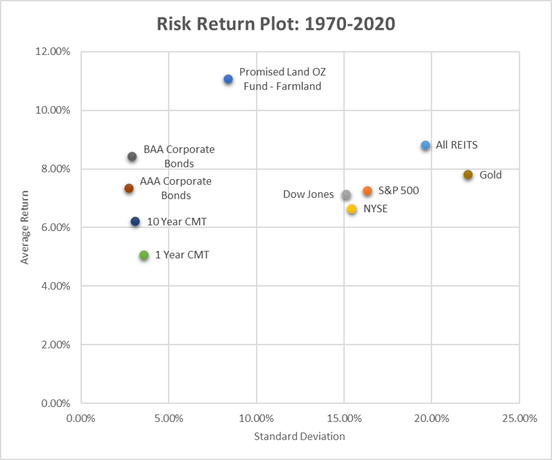
Data maintained by the TIAA Center for Farmland Research.
The Promised Land OZ proxy demonstrated the highest risk-adjusted return compared to the other asset classes over both time periods. PLOZ has the optimal position in the upper left-hand quadrant of the graph with a high return and overall lower risk compared to equities, REITS, and gold. Even in the last 20 years, the PLOZ proxy still yielded high, relative returns with lower risk.
The relationship between farmland and other investments can be further compared by examining the correlation of returns in the chart below. A value of 1 means two asset classes are perfectly correlated and would be expected to move up or down in tandem. A negative number suggests the two assets move in the opposite direction over time.
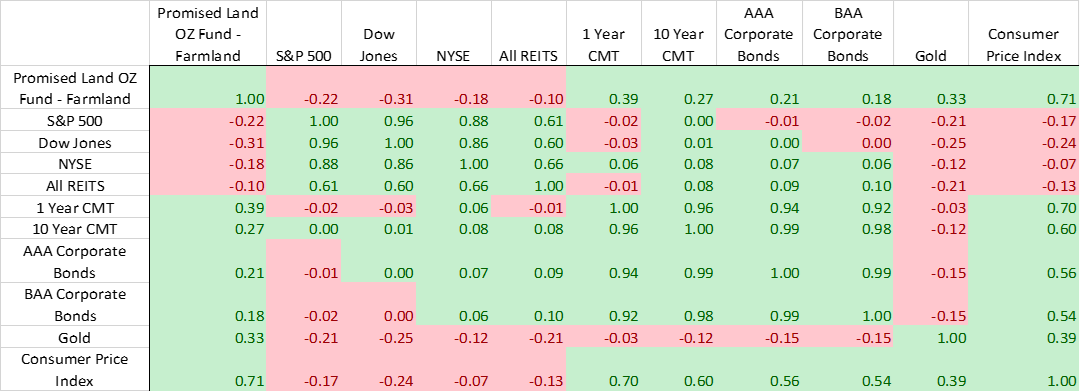
Promised Land’s negative correlation with stocks (S&P 500, Dow Jones, NYSE) gives reason to believe that farmland would provide diversification benefits and offset some of the volatility of these assets with high standard deviations (risk measure). In the more recent past (2000-2020), farmland’s negative relationship with stocks is even stronger with a -.32 correlation with the S&P 500. Note that when the S&P 500 dropped 48.6% in 2008 after the great recession, the Promised Land proxy maintained a positive return of 8.9%.
Relationship of Farmland with Inflation
Recently, investors have been concerned about inflation and how they will affect investment portfolios. The Labor Department recently reported that inflation had hit a 31-year high in October with the consumer price index (CPI) rising to 6.2%. Investors and economists across the globe are wondering if we are witnessing the death of Fed’s “inflation is transitory” narrative. Historically, stock indices have had a negative correlation with inflation and investors are concerned that these inflationary trends are long-term and secular in nature. Farmland on the other hand has historically provided a nice hedge against times of inflationary pressure. Examining the PLOZ proxy returns with CPI trends shows a positive correlation of .71, meaning historically an increase in the CPI will also increase returns to farmland. Recently this trend has held as some Midwest land is up 20% in value along with the higher consumer prices. See the figure below for more details. 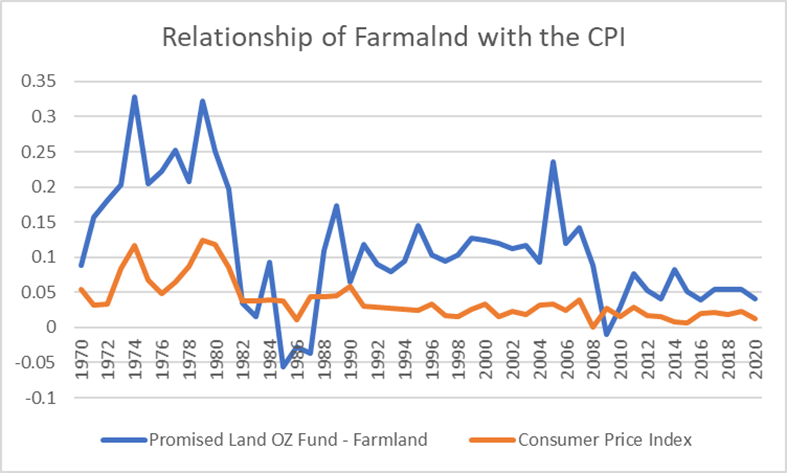
Investment Opportunities
With its potential return and diversification benefits along with its track record as an inflationary hedge, farmland is positioned well to have a complimentary role in a traditional 60/40 (equity/bonds) investment portfolio. To optimize on this potential, investors have a few different options to partake in farmland investing. The most obvious option is to buy farmland directly. However, this could be costly and comes with the requirement that the investor find capable management for the parcel. Buying a single parcel of farmland also puts the investor at more risk that comes from regional concerns like weather or farm-level (or idiosyncratic) risks like loss of production due to water or soil nutrient levels.

To alleviate some of the parcel management burden while still participate in farmland’s return and diversification benefits could be to invest in the Promised Land Opportunity Zone Fund. The fund is targeting internal rates of return between 8% and 14%, before consideration of the tax benefits it would provide to OZ investors. PLOZ’s mission is to help investors and agricultural communities achieve mutually beneficial outcomes through profitable, durable investing in farmland and the revitalization of rural American communities. In addition to its core “opportunity zone” impact, Promised Land is evaluating other environmental, social, and governance (ESG) principles, such as farmland preservation, wetland and forestland restoration, organic conversions, and soil health and carbon management practices. Promised Land’s vision is for these agricultural communities to prosper by feeding the world while OZ investors do well by doing good for these communities and the environment. If you are interested in learning more about the Promised Land Opportunity Zone Fund, please contact Ethan Rhee at ethan@servantfinancial.com.
Another option for investors would be to invest in Promised Land’s partner: Farmland Partners Inc. Farmland Partners Inc. (FPI) is a publicly traded company that acquires and manages high quality farmland throughout North America. FPI manages the farmland in the Promised Land Opportunity Zone Fund as well. FPI’s current portfolio consists of 157,000 acres in 16 different states. Currently FPI’s stock is trading for just over $12 per share which is up 50% from this time last year. We believe this is an attractive entry point below the fair value of the farmland that FPI owns. On their third quarter 2021 earnings call, CEO Paul Pittman, commented that the net asset value of the farmland was closer to $14-$15 per share. FPI has also restarted its growth and consolidation strategy. In addition to direct farmland acquisitions, FPI is growing its asset management business with its property management arrangement with Promised Land and its recent acquisition of Murray Wise & Associates.
With the risk of secular inflation on the rise and the inherent portfolio diversification, an investment in farmland is something all investors should be considering. By including an allocation to farmland in your investment portfolio, you’ll have a much more efficient portfolio and be “one up on Main Street” investors enamored with a traditional 60/40 investment portfolio.