


In the December 2022 newsletter, we featured “12 Investment Themes of Christmas” where we presented important forward-looking finance considerations for the approaching new year. We discussed economic themes surrounding interest rate trends, inflation, recession predictions, consumer spending, cryptocurrencies, and farmland among other topics. We thought a review of 2023 in the form of queries would be a good springboard for our themes for 2024 – a few questions before the quest for answers if you will.
1. Are Fed Hikes Finished?
In a bold move to address decades-high inflation, the Federal Reserve added 1% to its benchmark federal funds rate by way of four 0.25% hikes, bringing its target rate to a new range of 5.25% to 5.5%. However, the Fed has held its target rate steady since its last hike in July. These four increases follow a series of seven interest rate hikes in 2022 with the target rate ending 2022 at 4.25% to 4.5% up from 0.0% to 0.25% in March 2022.
The Fed appears to be done and will await the lagged effect of its aggressive hiking campaign. It is commonly believed that monetary policy works with “long and variable lags” (Milton Friedman dictum) of up to 18 months after a rate increase. Fed Chair Powell has made it clear that the Fed will retain rates at current high levels for an indeterminate period. Powell also left open the possibility of more rate hikes after the Fed’s mid-November meeting. The Fed will render its next interest rate decision in mid-December with the bond market expecting the Fed to remain on hold at this meeting.
The Fed’s commitment to addressing the challenges posed by inflation has been digested by the bond market with the market consensus of a first-rate cut pushed out until June 2024. This is consistent with the Fed Reserve Board’s most recent dot plot for a median Fed Funds Rate of 5.1% for 2024. But can we be certain that Fed hikes are finished?
2. Has Inflation Been Tamed?
The Fed’s aggressive interest rate hikes appear to be having a positive impact. Recent data reveals a notable drop in the inflation rate with the October 2023 headline Consumer Price Index (CPI) showing a 3.3% drop year over year. The headline CPI for 2023 currently sits at 3.2% with core CPI (less volatile food and energy) at 4.0%. This marks a significant improvement compared to the 6.5% headline inflation rate in 2022 but remains well above the Fed’s 2% inflation target. The slowing inflationary trend is great news for consumers and businesses. Lower inflation rates mean that the prices of goods and services are increasing at a slower pace, allowing consumers to make their hard-earned money go further.
While there are still challenges in the housing market with rising costs and slowing sales, the overall outlook suggests an optimistic shift toward lower inflation and eventually more affordable housing costs. If the Fed has achieved its goal of a soft economic landing with CPI heading towards its 2% inflation target, then homebuyers can expect lower mortgage payments as the Fed interest rate cuts begin. The Fed Reserve Board’s most recent dot plot for median headline PCE inflation (Personal Consumption Expenditures Price Index, the Fed’s preferred inflation measure) was forecasted at 2.5% and Core PCE of 2.6% for 2024. But can we reasonably expect that inflation has been tamed by the Fed absent some sort of economic fallout?
3. Is A Recession Inevitable?
Despite earlier concerns about a possible 2023 recession, the economic landscape has shown incredible signs of resilience and improvement despite the Fed’s rapid hiking campaign. Economic indicators such as unemployment rates and GDP growth are fundamental measures of a country’s economic health. The unemployment rate, which stood at 3.7% in 2022, has increased only slightly to 3.9% in 2023. This trend of modest softening of employment is consistent with the Fed Reserve board’s most recent dot plot for a median unemployment rate of 4.1% for 2024. Fortunately, the GDP growth rate on the other hand has surged from 2.1% annual run rate to 4.9% in the third quarter of 2023. This strong GDP growth suggests an economy more resilient than Fed expectations with increased job opportunities and improved consumer spending.
The Fed Reserve Board’s most recent dot plot calls for median 2023 GDP growth of 2.1% and GDP growth slowing to 1.5% for 2024.
Amazingly, the Fed dot plots for interest rate policy, inflation, employment, and GDP growth are all telling a synchronous tale of a Goldilocks economy – warm enough with steady economic growth to prevent a recession; however, growth is not so hot as to cause inflationary pressures and force additional Fed rate hikes. Is it possible the Fed porridge gets too cold, and a recession is inevitable or too hot and the Fed has to institute further rate hikes to cool its stew?
4. Is the U.S. Dollar Set To Rise?
The US Dollar Index has held relatively steady since the end of 2022 and currently sits at 104.20. Despite a small dip to 100 in July, the dollar continues to reflect the strength, resilience, and reliability of the U.S. economy. The U.S. economy’s resilient performance, coupled with the US Dollar Index holding its ground, underscores the Dollar’s status as a safe-haven asset. This is particularly notable in the global context where other major economies like China, Japan, UK and Europe are grappling with more pressing economic challenges such as recessionary conditions (China, Europe) and persistent inflation (Japan, UK). When a formerly synchronous global economy moves into economic and geopolitical disharmony, does the world’s reserve currency rise in value.

Source: MarketWatch
5. Will Consumers Keep Spending?
According to the latest data, consumer spending growth has risen 4.9% in 2023 following a 9% increase in 2022. This is likely attributed to rising wages and the largesse of COVID-era government spending programs. As these government programs are phased out, particularly the moratorium on student loan debt repayments, more and more people are taking on unnecessary debts and overspending, especially with very high interest rate credit cards. People are making luxury purchases, spending money on traveling, purchasing new cars and clothes, etc. In September of 2023, the total amount of U.S. credit card debt broke $1 trillion for the first time in history. This immense growth in consumer debt raises alarms about financial stability on both individual and systemic levels. More and more consumers will potentially face immense financial strain if the employment picture softens considerably or if illness impacts a household breadwinner. With Black Friday and Cyber Monday here, we’re about to see firsthand whether consumers will keep spending.
6. Perpetual Labor Shortages?
The labor shortage challenges identified last year persist into the current economic landscape. Industries across the board are struggling to find enough skilled workers to meet their business demands. This mismatch between demand and supply can stall economic growth, decrease productivity, and delay production and services. The worker shortage persists in all industries except for goods manufacturing, retail, construction, and transportation. There are currently 9.6 million job openings in the U.S. with only 6.1 million unemployed persons. Even if every unemployed person were to become employed, there would still be an insufficient workforce to meet the demands of employers. This is especially true for the financial services industry where only 42% of the existing job vacancies would be filled if all experienced and qualified professionals (in finance) joined the workforce. The shortage remains a critical problem for many industries and finding an effective solution is proving to be extremely challenging. Have we entered an era of perpetual labor shortages? If so, what does the mean for the inflation picture?
7. Is the Russian-Ukrainian War Really Ending?
The two-year old conflict between Russia and Ukraine, currently deemed a stalemate, has prompted the U.S. and its allies to signal the necessity of negotiating a peace deal. The prolonged nature of the conflict has decimated Ukraine’s national resources, particularly its military personnel, with reports indicating a disastrous shortage of soldiers. The U.S. Department of Defense’s (DOD) recent announcement on November 3, 2023, reveals an increased commitment to supporting Ukraine with equipment, but who will operate them? The DOD is supplying Ukraine with additional military vehicles and gear, $125 million for immediate battlefield needs, and $300 million through the Ukraine Security Assistance Initiative (USAI) to enhance Ukraine’s air defenses. This brings the total U.S. financial support for Ukraine to a staggering $44.8 billion which highlights a sustained and costly effort to support Ukraine’s defense against Russian aggression.
Sadly, new evidence is emerging that a peace deal was achievable at the beginning of the war. At a recent meeting with the African delegation, Putin showed the draft of an outline of a preliminary agreement signed by the Ukrainian delegation at Istanbul in April 2022. The peace deal provided for Russia to pull back to pre-war lines if Ukraine would agree not to join NATO (but Ukraine could receive security guarantees from the West).
Recently, there have been notable shifts in the pricing of key natural resources, such as softening in oil, gas, and agricultural commodities. This signals a potential easing of tensions and the removal of the market risk premium as the end of the war may be in sight. But if the same foolhardy political leadership prevails that rejected the potential peace deal in the early stages of Russia’s “police action” in Ukraine, how can we be fully confident the Russia-Ukraine war is really ending?
8. Will Energy Disinflation Continue?
Surprisingly, natural gas prices for home utilities have decreased by 20.8% since 2022. Gasoline prices at the pump have also declined with the average price per gallon dropping to $3.41 from $3.95 in December 2022. Gas prices are primarily dropping due to lower demand from drivers (less overall driving) and cheaper blends of gas (lower production costs mean lower costs at the pump). In the context of the U.S. economy, declining gas prices may signal a period of lower economic activity or a slowdown. Gas prices are expected to drop even more throughout the winter and into 2024 ahead of the summer driving season. This disinflationary pulse in consumer energy prices signifies ongoing adjustments in the supply-demand equilibrium and could have broader implications for consumers’ standards of living. A key question for consumers in 2024 is will this energy disinflationary trend continue and offset inflation pressures on household budgets elsewhere.
9. Are Bitcoin and Other Blockchain-based Businesses Institutionally Investable?
On November 2, 2023, FTX founder Sam Bankman-Fried, once a billionaire and a prominent figure in the worlds of crypto and politics, was convicted of one of the largest financial frauds in history. A Manhattan federal court jury found him guilty on all seven counts affirming that he had stolen $8 billion from users of his now-bankrupt cryptocurrency exchange. This verdict comes almost a year after FTX filed for bankruptcy which wiped out Bankman-Fried’s $26 billion net worth. This conviction is a substantial win for the U.S. Justice Department with Bankman-Fried facing a potential maximum sentence of 110 years.
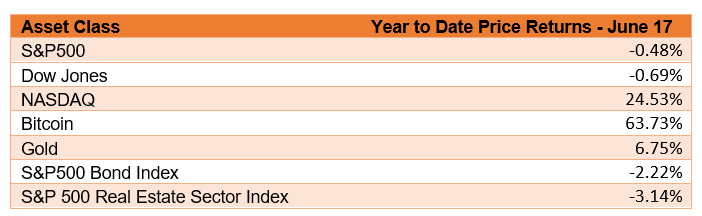
With the start of the FTX case, the price of all cryptocurrencies experienced a significant downturn due to shaken confidence in the crypto market and its many charismatic, entrepreneurial founders. However, proven, transparent blockchain-based business models are starting to rebound with Bitcoin emerging as a top-performing asset class for 2023. Year-to-date through November 17, 2023, bitcoin had gained 67% compared to gains of 26% for midstream energy (Alerian MLP Index), the second-best asset class, and 19% for the S&P 500, third-best asset class.
U.S. regulators at the Securities and Exchange Commission (SEC) have awoken from their slumber and are now taking a more proactive regulatory stance. After seemingly being asleep at the wheel, the SEC has been taking highly visible actions against bad actors like Sam Bankman-Fried and the CEO and founder of Binance, Changpeng Zhao. Zhao has recently stepped down from Binance after pleading guilty to violating U.S. anti-money-laundering legislation. He faces a $50 million fine and a potential prison term. In addition, Binance has agreed to pay a $4.3 billion settlement. Bankman-Fried and Zhao’s cases are part of a broader crackdown on crypto-related financial crimes and display the increased regulatory enforcement actions in the digital asset industry.
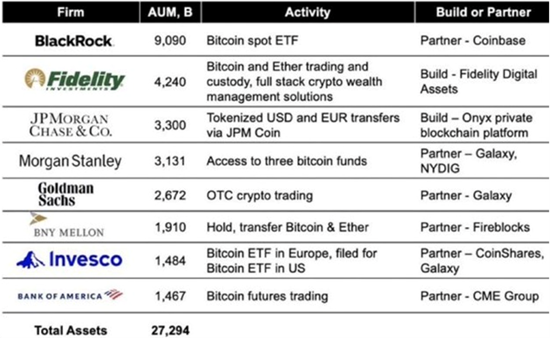
Proactive regulation and legislative clarity are welcomed by many of the leading crypto players like Coinbase, the largest U.S. cryptocurrency exchange platform, and Grayscale Investments, the world’s largest crypto asset manage based on assets under management and the sponsor of Grayscale Bitcoin Trust (GBTC). The expectation of increased legislative and regulatory clarity from Congress, the SEC, and the Commodities Futures Trading Commission (CFTC) in the near future has encouraged several brand-name, highly credible institutions, like BlackRock and Fidelity, to step into the digital asset space. The CFTC has determined that bitcoin is a commodity and the SEC and IRS have not publicly challenged that determination. We believe that legislative and regulatory actions in 2024 may emphatically answer the question, “Are bitcoin and other blockchain-base businesses institutionally investable?”
10. Will Student Loans Be Forgiven?
After the U.S. Supreme Court in June struck down his unilateral attempt to “forgive” at least $400 billion in student loans, President Biden has diligently sought a work-around to this reprimand from the highest court in the land. In October 2023, roughly 3.6 million Americans received a nice Christmas present from President Biden with potentially $127 billion of their student loan debt being forgiven. President Biden announced the plan earlier this year which brought joy and relief for some students and criticism and scrutiny from many other students and taxpayers(some of whom had already paid off their student loan debts). By alleviating a substantial portion of student debt, the plan aims to ease the financial burden on millions of Americans, providing them with increased financial flexibility and potentially curry their favor in the 2024 Presidential election. Based on annual income, students may qualify for student loan relief of up to $20,000.
The move has sparked considerable debate, drawing attention to questions of fiscal responsibility and the long-term impact on the country’s financial health and inflation rates. This also begs the question of where the money for this forgiveness will come from as the US government already faces $33.7 trillion of debt. The current iteration of student loan forgiveness rests on the Biden Education Department’s claims it has the authority to expand income-driven repayment under the Higher Education Act. This directive is subject to Congressional legislative oversight and/or Supreme Court challenge and begs the question, “Will Students Loans Be Forgiven?”
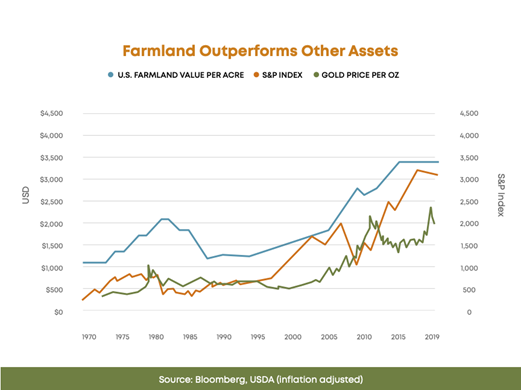
11. Will Farmland Continue To Be the Star Of the Show?
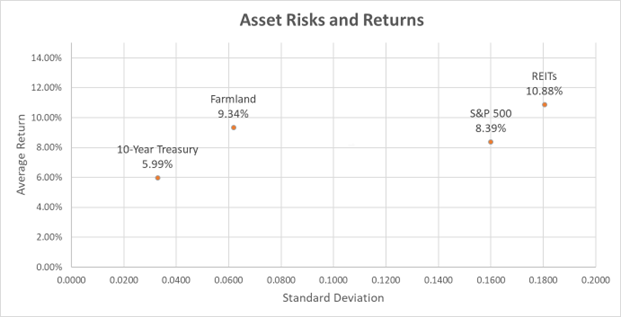
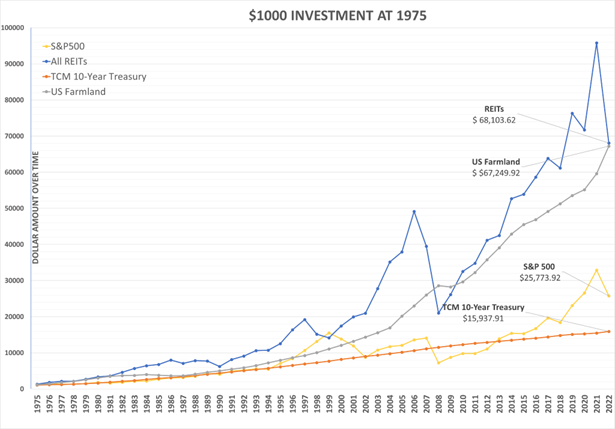
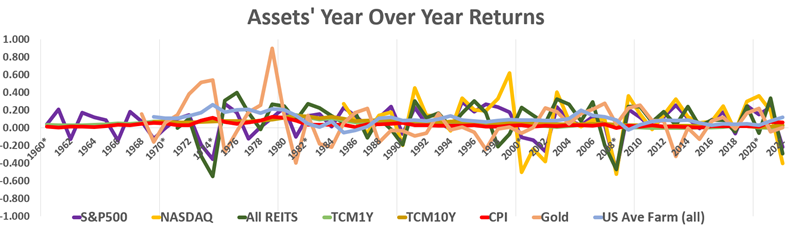
Farmland stole the mic the last few years as an emerging institutional asset class. Its low volatility and historical negative correlation with traditional assets and positive correlation with inflation had investors lining up to find their slice of farmland heaven. As a result of the increased interest, strong commodity prices, and global food demand, the value of farmland rose throughout the United States 15-25% in just a two-year period from 2020 to 2022. However, that growth had some wondering if it would continue through 2023. In August 2023 the USDA reported farmland valued appreciated 8.1% from 2022 to 2023 but we are starting to see some signs that transactions may slow in the new year. Growing input prices made planting commodities more expensive while commodity prices have declined from peaks in 2021 and 2022. While net farm income is projected to back off from a peak in 2022, it is still projected to remain modestly above the 20-year averages for net farm income and net cash farm income. Even if U.S. farmland leaves the podium as one of the top performing asset classes in 2024, it will always have a seat at the table because of U.S. agriculture’s vital role in making sure the 8.1 billion mouths across the world are fed.
12. How Should a Diversified Portfolio Change?
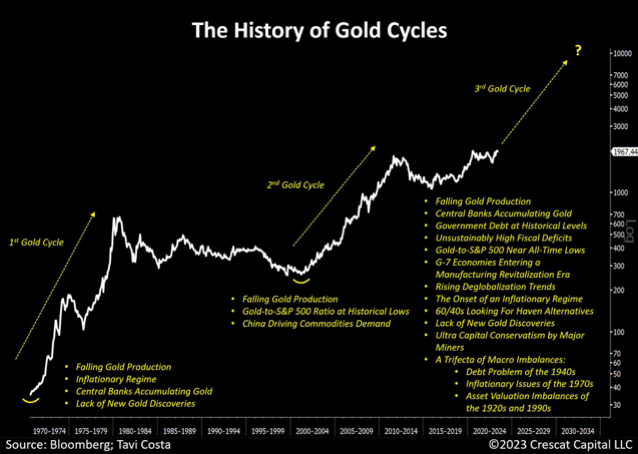
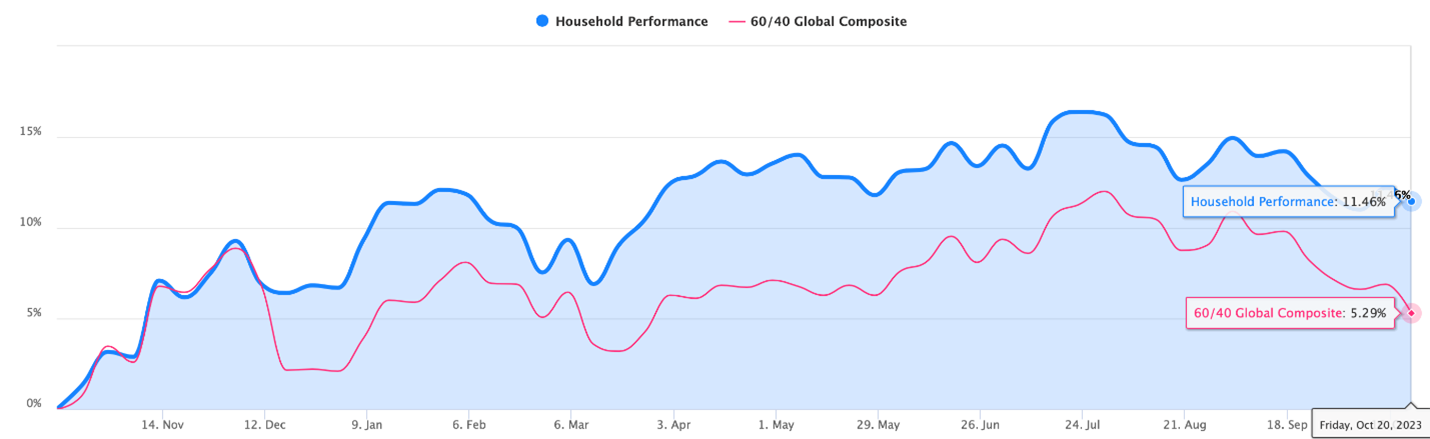
At Servant Financial, our role is to help you plot the course in these uncertain times. We understand that recent inflationary trends, costly patterns of increased geopolitical conflict, and increased economic and market volatility may cause investor unease. The basic investment principle of portfolio diversification has more often than not proven its character in the past and we expect it will continue to do so in the future. That’s why we are asking the questions now on behalf of our clients so we can continuously assess the risk-reward opportunity set now available. Last month’s featured article, “Got Gold?” established our foundational thinking that the traditional 60/40 (equities and bonds) portfolio allocation will struggle in an era characterized by economic uncertainties, inflation, and geopolitical unrest. Our task in the ensuing weeks and months is to live these foregoing twelve questions towards some range of likely outcomes and a capstone result that answers the question, “how should a diversified portfolio change?”