Email us at info@servantfinancial.com to talk to a financial advisor today!

Email us at info@servantfinancial.com

Leaping Out of Credit Card Debt

Every four years, Americans are given the rare gift of time. February 29th only appears on the calendars every 1,460 days marking the well-known holiday of Leap Day. This extra day brings about traditions across the world such as women proposing to men and is commonly called “Bachelor’s Day” or “Ladies Privilege.” In other countries, Leap Year is known as an unlucky year for agriculture and particularly sheep. There is an old rhyme that says, “Leap Year was never a good sheep year.”  So don’t be a sheep this Leap Year, do your own thinking, particularly on important matters.

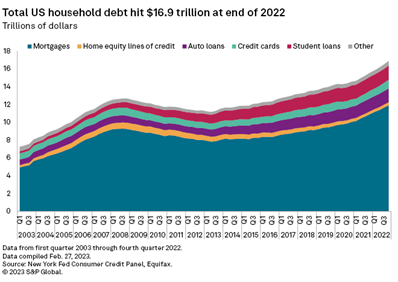
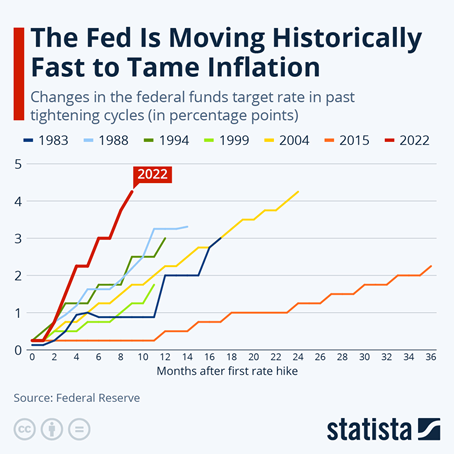
What does Leap Year mean for Americans? For credit card holders, it means an additional day to tackle the mounting $1.129 trillion debt Americans currently owe. Americans now have more credit card debt than ever before, and the COVID-19 pandemic only accelerated its “leap” higher. Credit card holders with unpaid balances hold an average of $6,864 with the highest average debt levels being owed by East Coast residents. The debt balances on these credit cards aren’t getting cheaper to carry either given rising interest rates. The average Annual Percentage Rate (APR) on credit cards is 21.47% making it even more difficult for consumers who have found themselves in the debt hole to “leap” their way out of it.

Source: Lending Tree


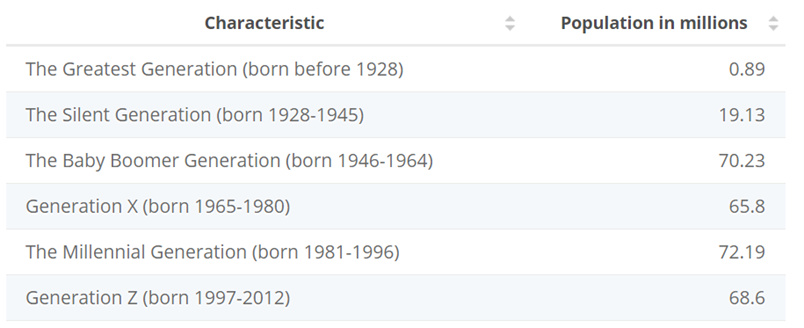
How did the average Americans find themselves in this dilemma? Higher prices at the gas pump and grocery store together with the increasing costs of housing have significantly contributed to the current crisis. Borrowers between the ages of 30 to 39 are particularly feeling the pain of rising interest rates as this age bracket often is also dealing with student loan debt repayments. Even though the U.S. economy continues its expansion, debtholders may be reaching a breaking point and be forced to scale back consumption.  Consumer expenditures represent approximately 70% of U.S. economic activity. The post-pandemic inflation levels were believed to be largely attributable to temporary supply chain shocks that would resolve themselves over time and prompted a slow response by the Federal Reserve. Credit card holders felt acute pain when a tardy Federal Reserve instituted an aggressive rate-hiking campaign to tame inflation. Some claim that debtholders are at fault for overspending and while that may be true, they are just taking a profligate spending lesson out of the Federal Government’s budget playbook. The current National Debt is hovering around $34 Trillion which comes out to an average of $102,279 per each American. Interestingly enough, the slope of the National Debt graph shows a very similar shape to the above graph featuring individuals’ credit card debt.

Source: U.S. Department of the Treasury


Even though credit card debt levels continue to rise, delinquency rates remain relatively low with only 3.1% of Americans with a balance that is more than 30 days delinquent. What do high debt levels and low delinquency levels mean? Huge profits for credit card companies. Currently, there are four major credit card networks in the United States: Visa, Mastercard, American Express, and Discover. Visa, Mastercard, and American Express have experienced rising earnings over the past several years as people swipe cards quicker and pay later. Not only are these companies leaping into financial success from higher individual card debt but also higher transaction fees. In 2022, credit card companies charged consumers an all-time high in interest and transaction fees of $130 billion.

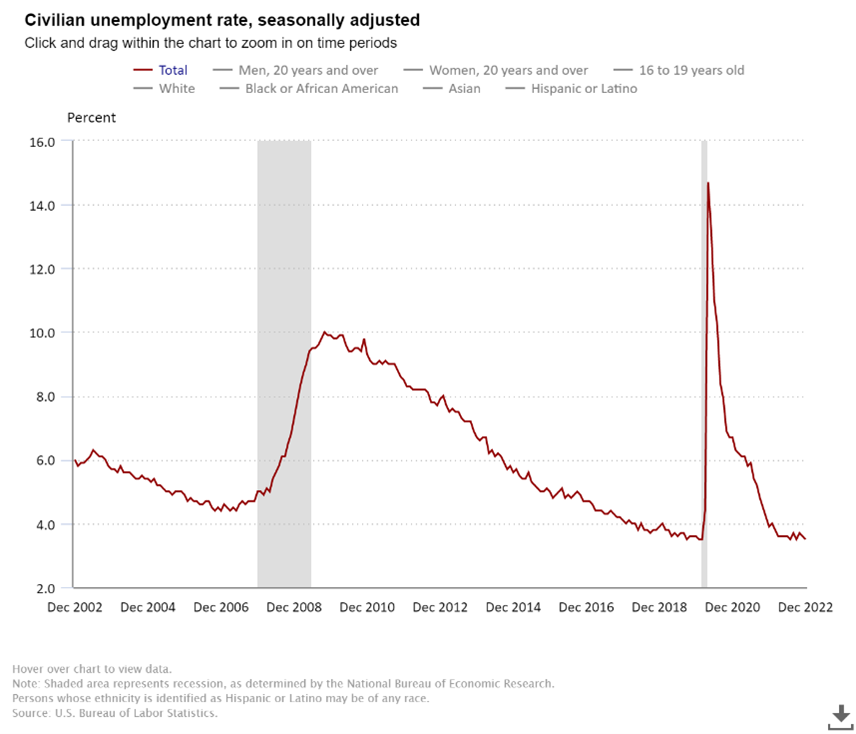
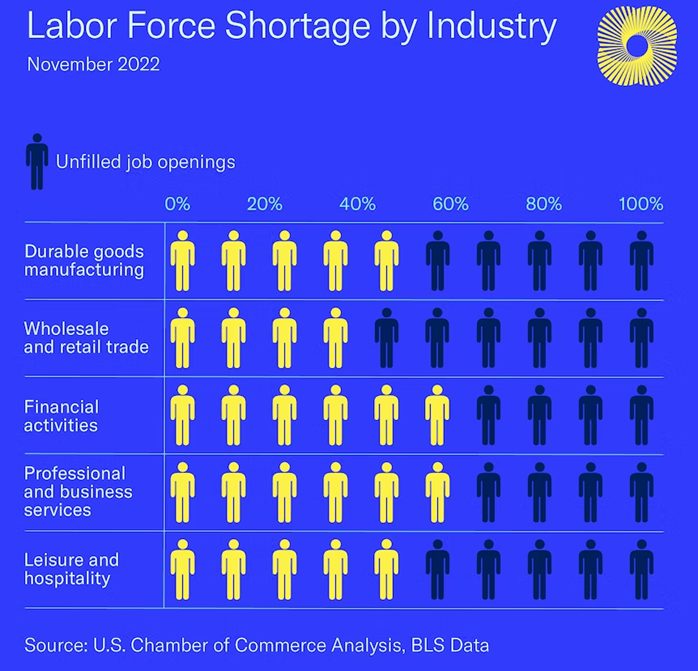
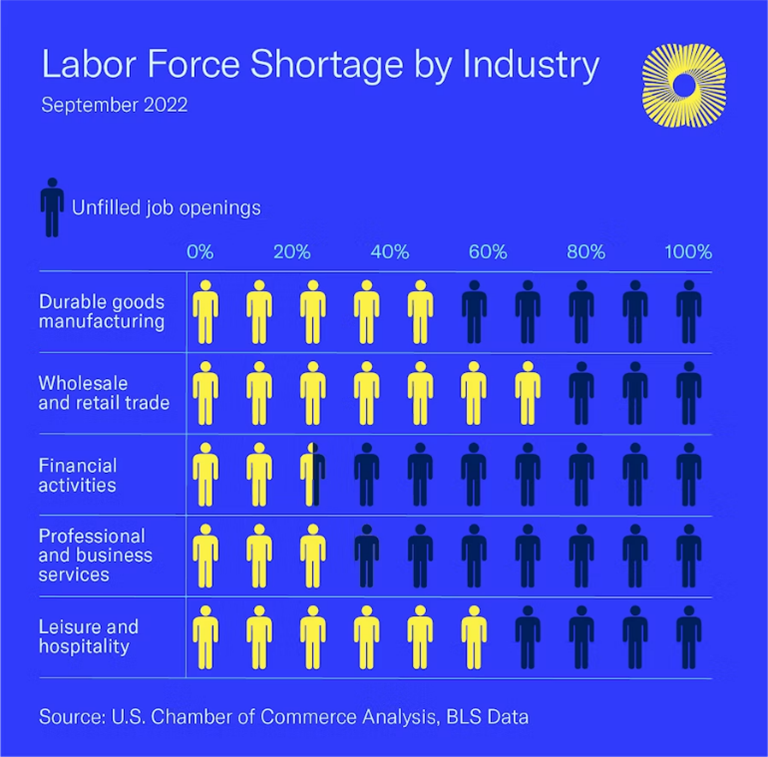
These oligopolies are only projected to get stronger and more concentrated as Capital One announced this month their plans to buy Discover Financial Services for a whopping $35 billion.  Discover shareholders would receive 1.0192 Capital One shares for each Discover share under the terms of the proposed deal.  Capital One desires Discovers’ independent card network to go with its Capital One Visa operating on the shared Visa credit card network.  As more consumers swipe plastic cards rather than pay with cash, financial services are taking notice of the “leap” in prospects for the credit card sector. Some worry the rising credit card debt is signaling a weakening economy, JPMorgan CFO, Jeremy Barnum, reported during their earnings call that consumers are adjusting to the end of government stimulus checks and government-mandated pause on student loan repayments. Other bank executives point to a strong labor market signaling that consumers can afford the high credit card balances.

Servant Client Portfolio Positioning

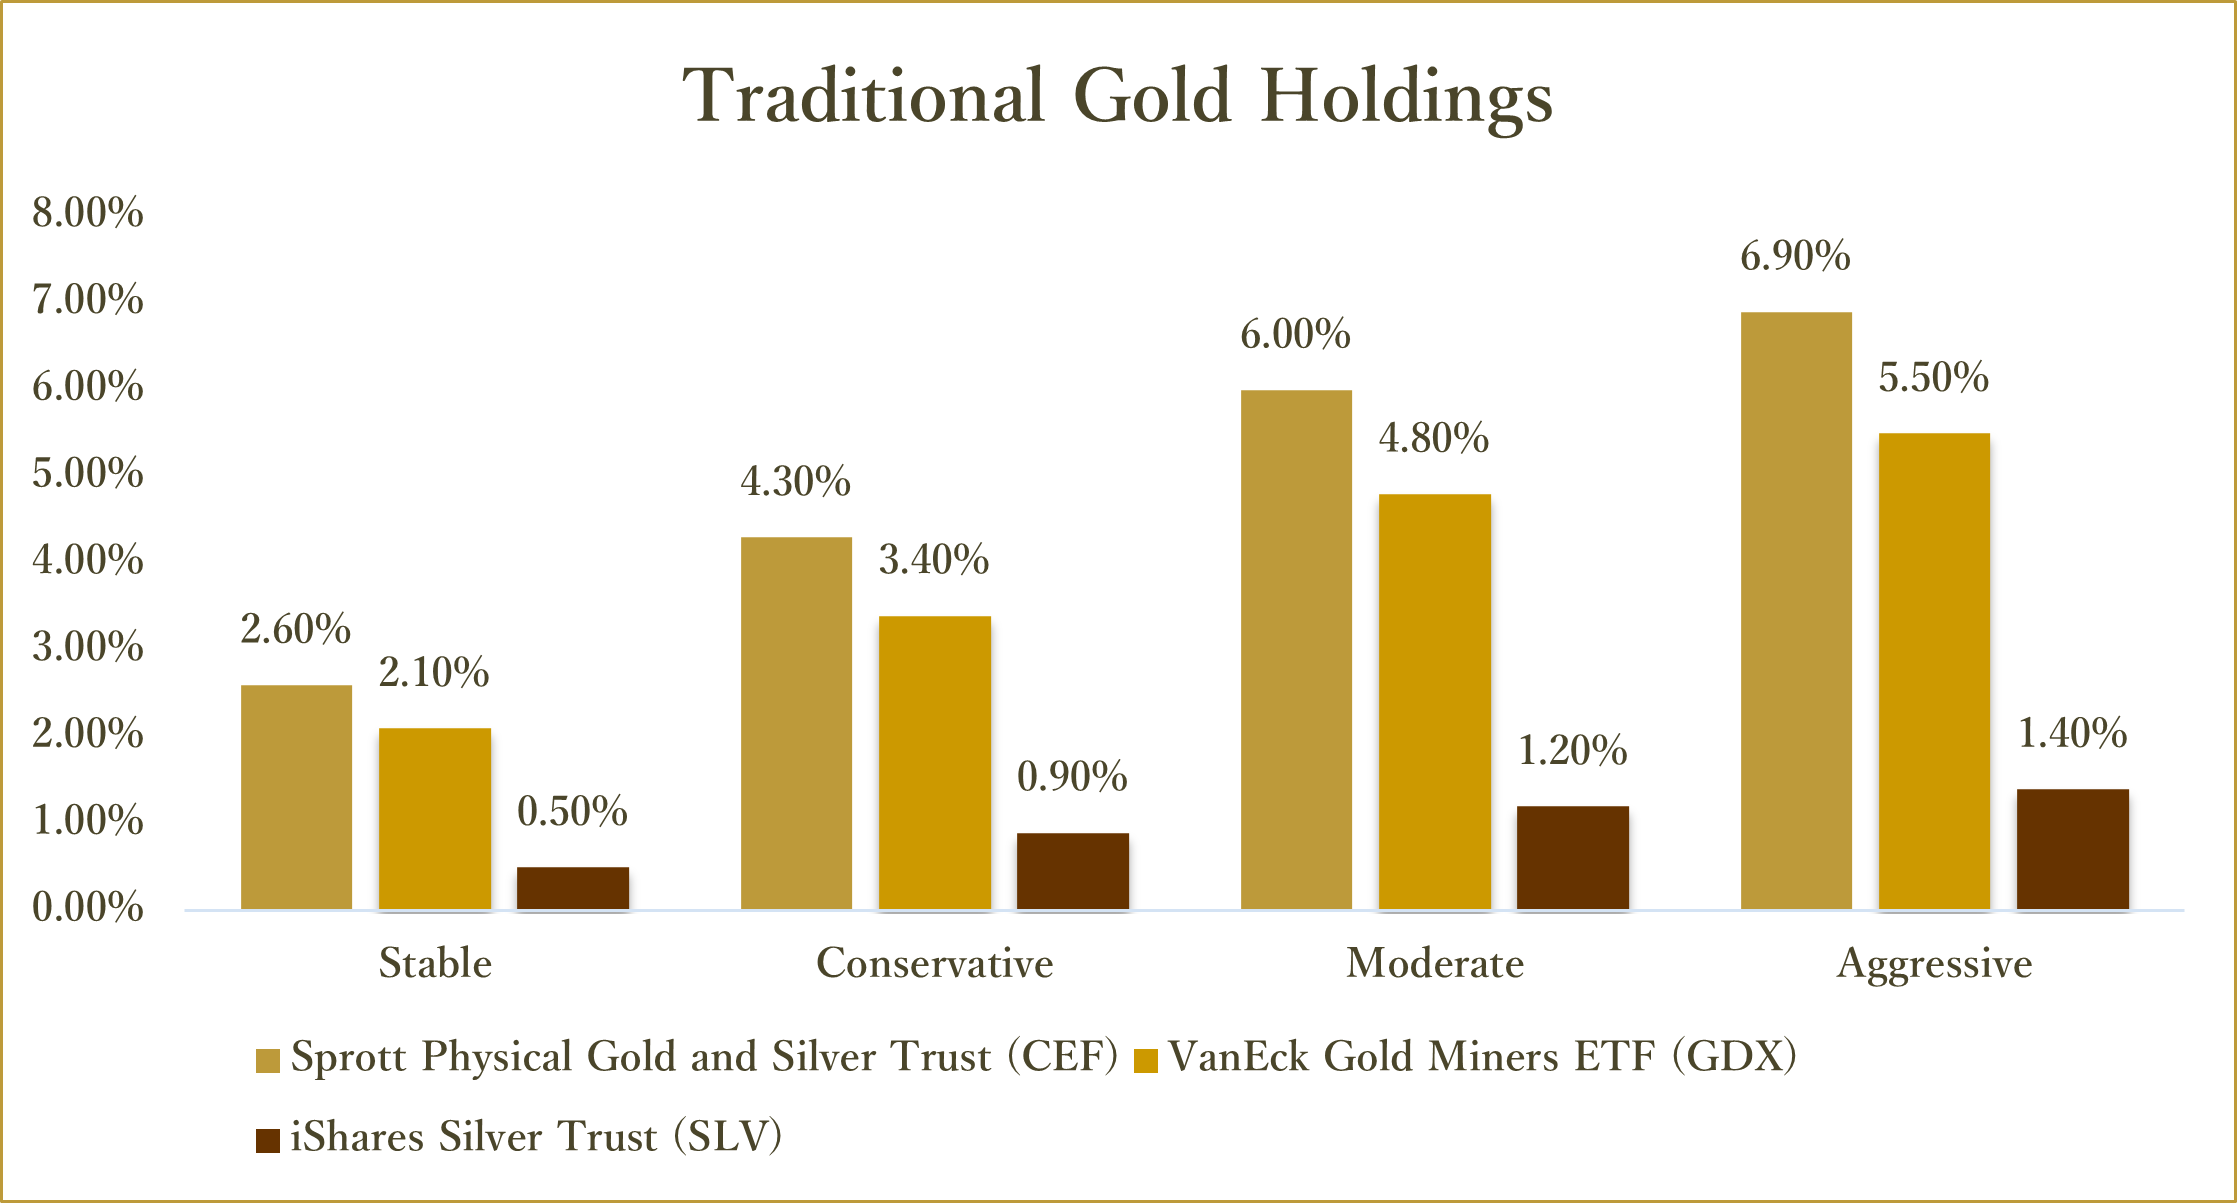
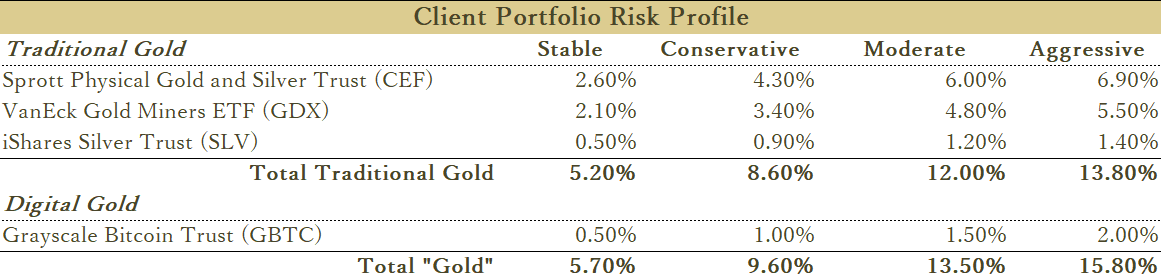
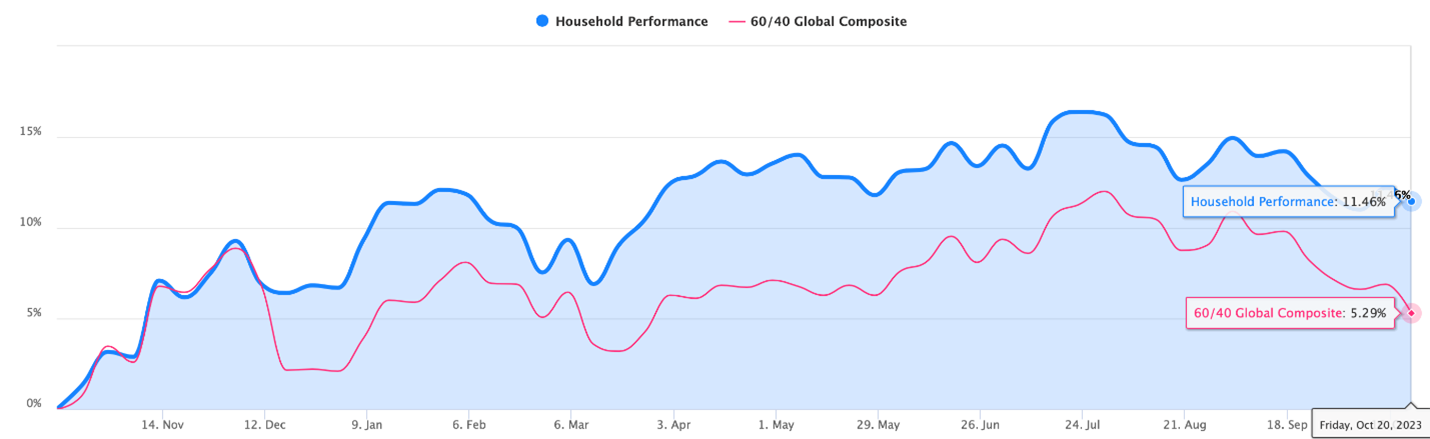
Here is our Leap Year summary of Servant client portfolio composition compared to traditional benchmarks.  A traditional 60/40 portfolio would hold 60% equities and 40% fixed-income securities and cash for a client with moderate risk tolerance.

1. Underweight equities

2. Overweight non-U.S. equities vs. U.S. equities

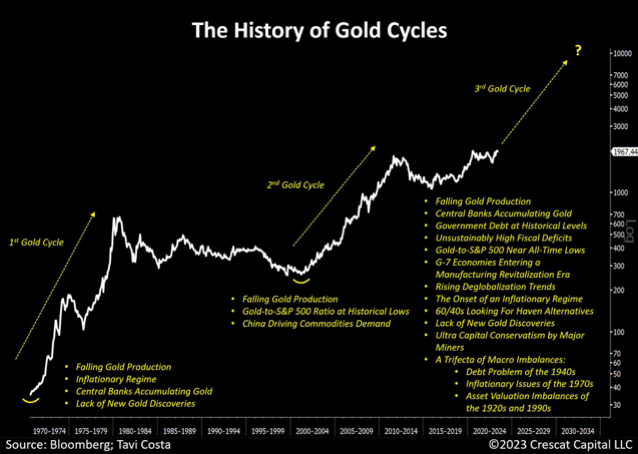
3. Overweight precious metals, gold miners, and digital assets/bitcoin

4. Underweight fixed income duration

U.S. equity valuations are near extremes.  For example, Hussman Fund’s February 26, 2024 newsletter “Speculative Euphoria and the Fear of Missing Out” states that “the valuation measure we find best-correlated with 10-12 year S&P 500 returns in market cycles across history is the ratio of nonfinancial capitalization to corporate gross value-added, including estimated foreign revenues (MarketCap/GVA).  Presently, this measure is higher than at any point before June 2021, with the exception of three weeks surrounding the 1929 peak.”

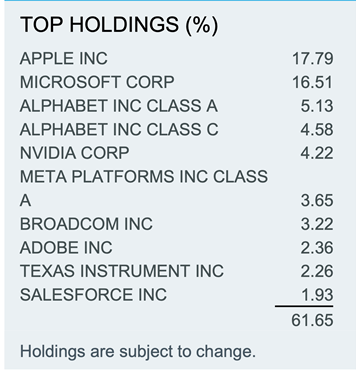
Likewise, market breadth is very, very narrow with the performance of the so-called “Magnificent 7” (U.S. tech behemoths Apple (AAPL), Amazon (AMZN), Alphabet (GGOGL), Facebook/Meta (META), Microsoft (MSFT), Nvidia (NVDA) and Tesla (TSLA)) diverging with NVDA soaring and TSLA tanking.

In our opinion, the aggregate stock market is priced for perfection and assumes inflation will sheepishly return to Fed’s targeted rate of 2% and a soft economic landing where a broad recession is avoided.  We see the potential for volatility in future economic data.  If such volatility were to occur, it could quickly “leap” into the stock market  For example, market projections for core PCE (Personal Consumption Expenditures), the Federal Reserve’s preferred inflation measure, remain closer to 4% than the Fed’s targeted 2%.  Further, recent economic data (employment and layoff announcements and retail sales) are consistent with a slowing economy.

We think the recent move in Bitcoin may be an economic tell.  Bitcoin has leaped from below $52k at the beginning of this week to breach $61k on the day of this writing on February 28th.  You may recall that Servant Financial initiated small allocations to client portfolios in 2020 of generally 1% to 2% based on the deep research that we conducted which showed that adding a small bitcoin allocation would historically benefit globally diversified portfolios by lowering risk while providing the potential for higher returns.  Market history has been rhyming lately.

John Heneghan recently received his Certificate in Blockchain and Digital Assets –  Financial Advisor Track from the Digital Assets Council of Financial Professionals so Servant Financial is prepared to serve your financial planning and investment needs regarding digital assets and bitcoin.

For more bitcoin-curious readers, we have been beta-testing a couple of more concentrated and volatile portfolios on the bitcoin, anti-fiat themes.  The first portfolio is focused on active best ideas in both the real asset and bitcoin/digital asset space.  This portfolio holds about 15 positions and has almost a 3-year track record.  The second and newer portfolio (10-month history) is much more speculative and holds only 6 positions – Fidelity Bitcoin Trust ETF (FBTC) and five other bitcoin-related businesses.  Please reach out if you are interested in learning more.

Leap Day is known to be a lucky day – good luck for some and bad luck for others. As Ray Charles sang, “If it wasn’t for bad luck, I wouldn’t have not luck at all.” One thing is sure, consumers cannot rely solely on good luck to leap them out of their debt holes because bad economic luck may be lurking around the corner. If you have found yourself struggling with high levels of credit card debt, we encourage you to check out the National Foundation for Credit Counseling for strategies and tips for your unique situation. Leap Day should not be just another date on the calendar; instead, view it as an opportunity to leap closer to financial freedom from credit card debt.


Got Gold?

Hedge fund investor and billionaire Ray Dalio of Bridgewater Associates once retorted “If you don’t own gold, you know neither history nor economics.” Gold interest began spiking again during the COVID-19 pandemic as investors flocked to real assets to hold their money in while equities were flopping. As the S&P 500, NASDAQ, and Dow Jones have started on a downward trend once again, gold has again been experiencing gains in value. Hopefully, most readers can answer yes when asked “Got Gold?”  Servant Financial clients can assuredly answer affirmatively as outlined at the close of this article.

Despite Dalio’s admonition, gold holders, or gold bugs as they are affectionally called, are in the minority of U.S. investors. The Gold IRA Guide conducted a survey in 2020 to reveal the opinions of Americans surrounding gold and silver ownership. 1,500 Americans were surveyed between the ages of 18 and 65+. The survey revealed that 89% answered “no” when asked “Got Gold?”  Only 10.8% of respondents owned either just gold (4.3%) or both gold and silver (6.5%). Some respondents just owned silver (5.1%), suggesting a combined 84% of Americans owned neither gold nor silver at that time.

An updated survey by Gold IRA Guide in May 2022 of 2,500 American households found that almost 4 out of 5 reported having done nothing with their investment portfolio or retirement accounts to hedge against generationally high inflation.  Consumer Price Inflation (CPI) was reported above 8% for all items in both March and April of 2022.  Frankly, I think this is a sad commentary on institutional money management because it is very likely that many of these survey respondents were working with trusted investment advisors.  Unfortunately, a large majority of money management firms have apparently not “studied history or economics.”  Lemming-like, many institutional money managers are beholden to the traditional 60/40 stock and bond regime that has worked so well for the last 3 decades since the start of the 1990s.

Ray Dalio has also stated that “There are two main drivers of asset class returns – inflation and growth.”  We know from history that growth has been the dominant driver since the 1990s aided by a secular decline in inflation and interest rates.  Unfortunately, over the next 30-plus years, our elected geniuses in Washington and their co-conspirators at the Federal Reserve mistook that secular trend for permanence and repeatedly doubled down on the mantra “deficits don’t matter.” While most American households cannot feasibly operate under a budget deficit, the U.S. government seems to think they can. Washington elites ignored “history and economics” by spending and printing without limitation.  It’s as if they were seeing the world through Morgan Wallen Whiskey Glasses:

Line ’em up, line ’em up, line ’em up, line ’em up

Knock ’em back, knock ’em back, knock ’em back, knock ’em back

Fill ’em up, fill ’em up, fill ’em up, fill ’em up

‘Cause (INFLATION) ain’t ever coming back.

However, it is now increasingly apparent that we are entering a secular period in history where inflation trumps growth as the primary driver of asset class returns.  Safe passage through this new secular inflationary period requires polishing up on the history of gold cycles.  The chart below from Octavio Costa at Crescat Capital provides a nice overview of gold’s price history since the 1970s.  It’s important to note on this timeline that in August 1971 President Nixon closed the “gold window” which prevented foreign governments from redeeming their dollars for gold.  Up until this point, gold had served as an important governor on U.S. spending and printing.

History shows that when gold was the primary monetary unit before the adoption of gold-backed fiat currencies, gold also served as a governor of war.  Would-be aggressors were limited in financing war against their neighbors by the amount of gold stored in their treasuries and the amount of gold booty or other resources they could recover from their conquests. The same goes for pirates and naval conquests.

For those readers interested in digging a little deeper into gold, we’ve found that the most comprehensive analysis of gold markets available is entitled “In Gold We Trust”, prepared annually by Incrementum.  Incrementum published their 417-page, 17th edition earlier in 2023 entitled Showdown | In Gold We Trust report 2023 (hyperlinked to YouTube summary presentation of the report).

Incrementum presciently entitled their May 2023 edition “Showdown.”  The report summarizes the four important Showdowns that they expected to play out over the next year or more:

  1. West Versus East Geopolitics
  2. Competing Currencies (BRIC+ Currency Bloc)
  3. Failing Monetary Policies
  4. Price of Gold (gold price advances have been tame relative to Incrementum’s cycle view)

Obviously, Incrementum was aware of the Russia-Ukraine “showdown” at the time of publication but likely could not have anticipated another violent “showdown” in the Middle East.  Sadly, the inhumanity of humanity intervened again in recorded history with another Middle Eastern war on the 50th anniversary of the Yom Kippur War of 1973 (also known as the Fourth Arab–Israeli War).  That war began on 6 October 1973, when an Arab coalition led by Egypt and Syria jointly launched a surprise attack against Israel on the Jewish holy day of Yom Kippur. Following the outbreak of hostilities, both the United States and the Soviet Union initiated massive resupply efforts for their allies (Israel and the Arab states respectively) during the war which led to a confrontation between the two nuclear-armed superpowers.

Source: Bloomberg, SpringTide

Incrementum included a thoughtful, far-reaching interview with former Credit Suisse economist Zoltan Pozsar.  Pozsar is a Hungarian-American economist known for his analysis of the global shadow banking system.  He published a widely read December 2022 analysis while at Credit Suisse entitled “War and Commodity Encumbrance”.

Pozsar has since started his own macroeconomic advisory firm specializing in funding and interest rate markets called Ex Uno Plures.  The firm’s name (“out of one, many” in Latin) is the antonym of E Pluribus Unum (“out of many, one”), the motto on the Great Seal of the United States and dollar bill.  The firm’s raison d’être and the main thesis of the War and Commodity Encumbrance whitepaper is that “for generations, investors have been operating in a unipolar macroeconomic environment, where the U.S. dollar reigned supreme globally and where E Pluribus Unum was the perfect motto to describe what became known as the global dollar cycle. However, the conflict between the U.S. and China is set to reshape the global monetary order centered around the U.S. dollar. De-dollarization, the re-monetization of gold, the invoicing of a growing number of commodities and goods in renminbi, and the proliferation of CBDCs (Central Bank Digital Currencies) will challenge the US dollar’s hegemony (“out of one, many”).”

Incrementum’s headline quote from the Pozsar interview reads, “Two percent inflation and going back to the old world, I don’t think it stands a snowball’s chance in hell. Low inflation is over and we’re not going back.”

Here are some of Pozsar’s specific recommendations from the interview for adapting to the New World Order as he sees it (emphasis added):

  • We are moving into a multipolar reserve-currency world where the dollar will be challenged by the renminbi and the euro for reserve currency status.
  • These currencies, especially the renminbi, would not necessarily be used as a reserve currency, but rather to settle trade. Gold could play an increased role here. (Pozsar notes that since 2016-17, the renminbi has been convertible to gold on the Shanghai and Hong Kong Gold Exchanges.)
  • The Chinese are using swap lines to settle international trade accounts. This is a fundamentally different approach from the dollar reserve framework and would mean that trade can occur in renminbi without nations needing to hold vast reserves of the currency.
  • The various crises that today’s financial market participants have witnessed were solved by throwing money at whatever problem arose. The current inflation problem is different.
  • This situation is also vastly different from the late 1970s when Paul Volcker curbed inflation by prolonged high-interest rates. Chronic underinvestment in the resource sector and labor issues will cause inflation to remain sticky.
  • The traditional 60/40 portfolio allocation will struggle in this environment. Pozsar recommends a 20/40/20/20 (cash, stocks, bonds, and commodities) allocation.

Commenting further on the commodities allocation Pozsar echoed the words of Dalio on “gold, inflation and growth”:

“Within that commodities basket, I think gold is going to have a very special meaning, simply because gold is coming back on the margin as a reserve asset and as a settlement medium for interstate capital flows. I think cash and commodities is a very good mix. I think you can also put, very prominently, some commodity-based equities into that portfolio and also some defensive stocks. Both of these will be value stocks, which are going to benefit from this environment. This is because growth stocks have owned the last decade and value stocks are going to own this decade. I think that’s a pretty healthy mix, but I would be very careful about broad equity exposure, and I would be very careful of growth stocks.”

Servant Financial client portfolios have long held, meaningful allocations to gold.  Below is a summary of gold allocations by client portfolio risk profile:

The chart below provides the performance of a Moderate Risk client portfolio after management fees against a traditional 60/40 global composite portfolio (without management fees) over the past twelve months ended October 20, 2023, and highlights the benefit of holding traditional gold and precious metals and digital gold over this time. (Past performance is not indicative of future performance.)

Moreover, bitcoin broke emphatically through the $34K level on October 24, 2023, and is up some $8,400, or 32%, in the past 30 days after the United States Court of Appeal issued a court mandate this week requiring Grayscale Investment’s application for a spot Bitcoin exchange-traded fund (ETF) to be reviewed by the Securities and Exchange Commission (SEC).  The mandated SEC review could potentially pave the way for the conversion of the Greyscale Bitcoin Trust (BTC) from a trust (trading a week ago at a 12% discount to the net asset value (NAV) of underlying bitcoin held) to a spot ETF trading much closer to NAV. Servant predicted this “Bitcoinalization” as we coined it back in July of this year.

The title of this month’s newsletter is a hat-tip to the highly successful “Got Milk?” ad campaign of the 1990s and early 2000s.  Trends in consumption and investment evolve, affected by the cyclical and episodic nature of humanity and a myriad of factors from health and ethical concerns to technological innovations and geopolitical events. Just as the dairy industry has faced challenges and adapted, the gold investment landscape is also undergoing a transformation and monetary renaissance. The intrinsic value of milk as a household staple of a well-balanced diet is akin to the enduring value that gold brings to a well-diversified investment portfolio.  Just as there have been resurgences in milk consumption through innovation and adaptation, the allure of gold, gold miners, and other scarce stores of monetary value remains. A “Got Gold?” mindset offers investors a timeless refuge, especially in an era characterized by economic uncertainties, inflation, and geopolitical unrest.


Blessing for Peace

May those who make riches from violence and war,

Hear in their dreams the cries of the lost.

Excerpt from the poem by John O’Donohue


Speeding Towards the E.R. – Economic Recession

Somebody Call 911, the U.S. Economy is Sick.

Ambulance sirens blare, doctors prepare, and the patient is on their way to the E.R. with little time to spare. The patient is the U.S. economy which is on its way into the E.R. – Economic Recession that is! Anxiously waiting for the wellness diagnosis are U.S. consumers, Wall Street investors, and analysts around the globe. A recession is defined as a “significant, extensive, and lingering period of economic downturn.” Some may argue that since COVID-19 we have been experiencing these symptoms as inflation persists and equity markets tumble. But who diagnoses a recession or determines economic well-being? The r-word has been tossed around over the past few years by Wall Street experts, media pundits, and struggling consumers but the entity that gets the final say is the National Bureau for Economic Research (NBER). Unlike the relatively timely results from your personal physician, NBER’s diagnosis can be painstakingly slow. It took 366 days for NBER to announce its recession conclusion after the 2008 financial crisis. That’s like sitting in your doctor’s office knowing you are seriously ill with common flu symptoms, yet the doctor will not accept the obvious diagnosis and prescribe anything until they rule out every other ailment first.

So, what’s the hold-up? Why does it take so long for NBER to call a recession? Much like doctors, several tests and conclusions must be drawn by NBER before a formal recession decision is made. NBER states “It waits until sufficient data are available to avoid the need for major revisions to the business cycle chronology.” Their goal is to not sound an alarm that could cause consumers and investors to make premature decisions before all the data is analyzed. In other words, NBER does not want to be the proximate cause of a recession.  The effects of a recession diagnosis can radiate through the economy and impact government policy decisions.   Accordingly, NBER takes its time to confirm a recession has occurred well after that conclusion has been universally accepted. Not only do they take their time calling a recession, but they also wait to confirm the economy has healed and an economic recovery has taken hold. It can also take more than a year for NBER to make the call of a recovery. See below.

Source: Newsweek

The symptoms of a recession can vary and are unique in each case. Many define a recession as two consecutive quarters of falling real Gross Domestic Product (“GDP”); however, NBER evaluates a variety of metrics before making the call. NBER analyzes data about labor markets, consumer spending, business spending, industrial production, and overall income. They take a more holistic approach to analyzing the economic situation rather than using a practical rule of thumb or threshold to trigger a recession diagnosis. So, let us look at the current vital signs of the U.S. economy.

Vital Sign #1: Gross Domestic Product

The U.S. economy’s GDP is a key benchmark of economic performance. GDP measures the value of the final goods and services produced in the U.S.  As an economic vital sign, typically a recession diagnosis is given when the economy’s GDP experiences two consecutive quarters of negative GDP growth. The economy experienced this already during the first half of 2022.  There was considerable debate in many circles about a recessionary call at that time given the one-time distortive impacts of COVID-19 preventive measures.  Consensus GDP projections for 2023  were for growth of around 2.5% in the first quarter. The Commerce Department announced on April 27th that GDP growth slowed to a 1.1% annual rate as consumers retrenched due to high inflation and rising interest rates.  Reported first quarter 2023 GDP marked a slowdown from inflation- and seasonally adjusted 2.6% growth in the fourth quarter of 2022 and 2.2% average annual growth in the 10 years before the pandemic. This rapid slowing in the U.S. economic pulse sets the stage for a potential recession in the second half of 2023 if this vital sign continues to deteriorate.

Vital Signs #2, #3, and #4: Inflation, Federal Reserve’s Monetary Policy, and Bank Instability

While persistent inflation is not necessarily a sign of recession it can be the first domino to fall in a series of economic drivers. Inflation has been causing the United States economic discomfort for the past year and its peak of over 9% was like a sharp pain in the gut of the U.S. economy. Chronic inflation caused the surgeons at the Federal Reserve and U.S Treasury to grab their scalpel and open up the patient to take a closer look. In last month’s article entitled Jeromeggedon and Calamity Janet, we highlighted the banking and economic trauma caused by the sheer force of the Fed’s aggressive rate hiking campaign and the potential damage to the banking system, a lifeblood to the U.S. economy. This aggressive monetary policy has caused the yield curve to invert which is a telltale sign that the patient isn’t well, and it is a reliable signal of an oncoming recession. Typically, banks profit on the spread between longer-term assets and the interest paid on short-term liabilities such as bank deposits.  However, if the yield curve is inverted, bank profitability is problematic. As a result, banks may have to lessen their lending activities which can reduce economic growth. Moreover, today banks can deposit their excess reserves at the Federal Reserve and safely earn 5% on the Federal Funds Rate. This further depresses bank lending.

The inverted yield has already caused a few banks to collapse that anticipated inflation to be “transitory” after comments made by Fed Chairman, Jerome Powell in 2021. However, inflation persisted causing the Federal Reserve to aggressively hike interest rates.   This caused long-duration securities to fall in value, taking Silicon Valley Bank down with it. Concerns surrounding bank stability have arisen and depositors have already started to reduce their bank deposits below the FDIC’s $250,000 insurance limit. The fallout from the banking crisis has economists and the Federal Reserve cautioning that a recession is probable later this year. Not everyone agrees about the potential unhealthy condition of the banking system as the Vice Chair for Supervision, Michael Barr, said the banking sector “is sound and resilient.” While there are multiple opinions about the diagnosis and prognosis of the US economy, the banking sector should at least be considered an acute care patient and continue to be closely monitored.

Vital Signs #5 and #6: Consumer Spending and Unemployment Levels

“It’s a recession when your neighbor loses his job; it’s a depression when you lose your own.” – Harry Truman. But what would President Truman have to say about an economy that is experiencing some of the lowest unemployment levels ever, but the central bank is signaling a recession beginning later this year? Consumer spending has not appeared to be slowing much even as recession fears among economists persist. Retail spending jumped 3% from December 2022 to January 2023.  Yet the consumer appears to be leveraging future income to meet consumption as consumer debt levels have reached historic peaks.  And while its growth has tapered a bit in recent months, household debt is projected to reach the highest value in history with the personal savings rate also declining after hitting its pandemic high at almost 35%. Credit card debt is at an all-time high with U.S. household credit card debt reaching $986 billion in 2022, a 15% increase from 2021. While some see this metric as a strength of consumer sentiment, others believe that Americans are having to put more and more on credit cards to keep up with rising prices and wages that have stagnated.


Source: SP Global

Some people may look at consumer spending and wonder when consumers will start to crumble and begin reducing their consumption and spending. However, the continued strong economic outlook for the job market has some wondering if a change in consumer behavior will even happen. Historically, recessions are characterized by weak job markets and subsequently reduced consumer spending. However, this is not the type of labor environment we are experiencing right now. With an unemployment level hovering just above 3% and consumer sentiment scores still strong, American workers remain confident in their job security and ability to maintain income and spending levels. Consumers who are confident about their job prospects and income level will likely continue to spend and finance purchases on credit cards.

The strong job market has been an important vital sign for consumers however it has been to the detriment of many employers. “Help Wanted” signs continue to be posted in a variety of businesses from retail to finance and technology. Companies are having a hard time filling open positions and coupled with continued supply chain lags, their production has slowed. This fact has many economists intently focused on government and private market reporting on employment statistics, watching closely for early symptoms of illness in the job market.

The Prognosis and Prescription

So, what’s the overall prognosis for the U.S. economy? Will the old adage “an apple a day keeps the recession away” hold true in the upcoming year? Both the Federal Reserve and economists have signaled the economy is likely to enter a recession within the next 12 months.  Many economists, like physicians often do, put a little sugarcoating on their messaging using terms like “mild” or “treatable”  The most up-to-date leading economic indicators from The Conference Board point to a 99% likelihood of a recession over the next year with the root causes stemming from the Federal Reserve’s interest rate hikes and tightening of financial conditions within the banking sector. The Federal Reserve has predicted a mild recession to begin later this year with a recovery happening over the next two years.

Investors have been watching recession vitals closely and some argue that recessionary fears are already priced into the market. We believe this market is at historically high relative valuation levels and is priced for an economic soft-landing or shallow recession rather than the median historical recession.  The S&P 500 for example has continued an upward trend since January even as recessionary fears grew.  This U.S. large cap valuation index has moved higher mostly on the back of a handful of large technology names.  Further, while earnings expectations for 2023 have come in, they are only showing a mild earning contraction over 2022 which would be a highly favorable outcome for the typical recessionary period.

Given this prognosis, we lowered risk elements across Servant client portfolios by lightening up allocations to a) equities and b) inflation hedges earlier in April.  Proceeds were deployed into short-term treasuries and high-quality corporate bonds.  Note we were conservatively positioned across investor risk profiles prior to these tactical moves.  These trades further increased our equity underweight.

We trimmed allocations to Distillate U.S. Fundamental Stability & Value ETF (DSTL) by a third and deployed proceeds into iShares iBonds December 2024 Term Treasury ETF (IBTE).  We also swapped allocations to iShares 0-5 Year TIPS Bond ETF (STIP) for Invesco BulletShares 2026 Corporate Bond ETF (BSCQ).  The STIP inflation hedge has played its important portfolio buffering role well as inflation moved from “transitory” to “chronic” in Dr. Powell’s medical charts.

The motivation for the equity trimming is purely a function of stock market valuations rising into a deteriorating economic backdrop, creating an even more unfavorable risk/return set up.   We continue to believe that crucial pillars to the economy and markets are trending in the wrong direction and opportunities for a smooth transition out of elevated inflation are running out of time. Issues in the banking system may also cause further economic disruptions at the same time the elongated negative real wage growth cycle for consumers will ultimately force real spending to slow.

In short, the stock market is priced for mild or “transitory” case of economic recession in line with Fed speak while we are discounting the downside case that the economy is speeding towards the E.R. with potentially more acute or “chronic” conditions.

Where Have All the Good Workers Gone?

Reminiscent of the 1984 Bonnie Tyler hit from Footloose, many US employers are crooning for working class heroes. “I need a worker, I’m holding out for a worker ‘til the end of 2023.” The U.S. labor force has been dwindling from food and beverage service to financial analysts since the COVID-19 pandemic began. While some have been quick to blame the shortage on several rounds of government relief money that idled some workers, a combination of factors is influencing this labor change. Millions of people were suddenly unemployed at the start of the pandemic and many industries assumed these people would return to work when normalcy resumed. However, almost 3 years after the start of the pandemic, these “missing” workers may never return to the labor force. This labor shortage could cause a secular shift in American businesses and labor markets.

COVID-19

Government and businesses’ responses to COVID-19 brought about a 50-year high in unemployment, peaking at 14.7% in April 2020. Service workers and business professionals found themselves suddenly without work and wages. The U.S. government came to the rescue, handing out $5 trillion in pandemic stimulus money with a large portion devoted directly to individuals in the form of stimulus checks and extended unemployment benefits. When evidence of a growing labor shortage emerged, many people pointed fingers at the U.S. government for providing so much monetary support and disincentivizing workers to return to the job market. However, the story isn’t that simple. Fears of contracting and spreading COVID and the existential risk of mortality created a widespread shift in lifestyle priorities and an increased desire for a better work-life balance. The result of these factors has been the rise of remote labor and gig workforces. A study done by the U.S. Chamber of Commerce found 91% of survey participants hoped they could continue to work remotely at least part of the time. Businesses have generally adapted to this desire and been accommodative.  However, remote labor isn’t really a possibility for customer-facing service roles or manufacturing jobs for which labor activities are concentrated in a single location.

The U.S. Labor Department reported 10.5 million job openings in November 2022 with the labor participation rate at 62.3%, down from 63.3% in February 2020. Not only do service industries have their “Help Wanted” signs out but so do financial services and professional and business services. While workers are demanding more remote work, these professional industries are demanding people come back to work in their office buildings to collaborate with their colleagues. Workers have been less receptive to this return to the office mandate causing worker turnover rates to reach 57.3% in 2021, up from 45% just two years earlier. Businesses that have been able to accommodate their workforce’s desires for at least partial remote work are generally experiencing lower turnover and avoiding severe labor shortages.

No More Baby Boomers

Economists argue that this labor shortage was always on the demographic table. The labor participation rate has been on a downward trend since 2000 and some argue it is as simple as the laws of supply and demand. One of the largest generations in U.S. history, the Baby Boomer generation, is clocking out with no plans to punch back in. The median age of the Baby Boomer generation (born 1946-1964) turned 66 last year meaning many boomers are taking a refrain from Johnny Paycheck’s 1977 hit song, “Take This Job and Shove It” and checking into retirement. The next generation behind the boomers, Generation X, is about 5 million people short to fill the employment hole the boomers are leaving. The next generation able to take the Boomer’s place is the Millennials; however, it is still going to be several years before they enter the labor force. COVID-19 only intensified Boomers leaving the workforce as older generations were more susceptible to adverse outcomes from the virus. Boomers were also less likely to adapt to changes toward more remote work.  This trend may have something to do with the adage of old dogs and new tricks.

Source: Statista

These trends in labor demographics are not likely to be resolved any time soon as the World Bank projects the number of people between the working ages of 15 and 65 is set to decline by 3% over the next decade. “Without sustained immigration or a focus on attracting workers on the sidelines of the labor force, these countries simply won’t have enough workers to fill long-term demand for years to come,” said the chief economist at Indeed. Historically, immigration and globalization have helped bridge the labor gap; however, during the pandemic we saw a reversal of both trends. Policy reform towards immigration will need to happen if the U.S. wants a sufficiently dynamic labor force in the years to come.

Is the End in Sight?

The question begs, how long will this domestic labor shortage last? While a body of evidence suggests this is a systematic change, other economists argue a potential shift into a recession could help lower demand for labor and bring the labor situation towards equilibrium. The shifting landscape of the U.S. economy toward a recession would likely reduce hiring levels as companies are forced to cut back on growth plans. While we may see an uptick in unemployment levels, it is doubtful it will reach the near 10% unemployment levels the Great Recession of 2008 brought. The looming recession and persistent inflation point to a normalization of the labor market in 2023; however, some companies are still going to need to make adjustments to their business models to compensate for the loss in workers.

Companies are beginning to readjust their hiring strategies and their job expectations to accommodate the current labor market conditions. Inflation has made it difficult for companies to keep pay scales in line with the cost-of-living increases. It is going to be increasingly important for companies to be proactive with their employment strategies and stay ahead of the trends in worker lifestyle demands if they want to retain good talent. Companies such as IBM (Ticker: IBM) predicted this shortage long ago and began outsourcing their talent to countries with growing populations such as India. They have been able to capitalize on lower market-based wages in these developing countries and cheaper input supplies.

Meanwhile, the technology sector is busily working on solutions to these labor shortages, like artificial intelligence and machine learning.  The most recent market hero in this space is ChatGPT from the venture firm OpenAI.  ChatGPT optimizes language models for dialogue. The ChatGPT model has been trained to interact with users in a conversational way. This format makes it possible for ChatGPT to answer follow-up questions, admit its mistakes, challenge incorrect premises, and reject inappropriate requests. Several in the Twittersphere claim that ChatGPT has passed portions of the Bar Exam, medical license exam, and MBA operations exam. Further, experts interviewed by UK’s Daily Mail believe ‘AI will take 20% of all jobs within five YEARS’ and explain how bots like ChatGPT will dominate the labor market. According to the article, Microsoft invested $10 billion in ChatGPT and said that the technology will change how people interact with computers.

From our standpoint, the best way for investors to express a purposeful view on the future emergence of artificial intelligence and machine learning is through the leading technology heros, like Microsoft and Apple, who have massive distribution capabilities through their existing software and hardware product suites and business relationships across sectors. We like iShares U.S. Technology ETF (IYW).  This ETF provides exposure to the leading U.S. electronics, computer software and hardware, and IT companies.  IYW’s boasts assets under management totalling $7.8 billion and a reasonable expense ratio of 0.39%.    IYW has traded down 35% in 2022 and trades at an estimated 2023 price to earnings ratio of 23 times.  The following summarizes IYW’s top holdings:

We recommend buying IYW on future weakness and sitting on the sidelines holding out for a hero ‘til the morning light. In other words, wait until the next recession and buy these tech heroes who are strong, fast, and fresh from the fight.

Twelve Themes of Christmas

Contributions made by: John Heneghan & Michael Zhao


‘Twas the week before Christmas, when all through the financial house, not an investor was resting, not even a DC louse. 2022 brought investors increased market volatility and a wide array of risks and uncertainties remain, yet some opportunities may lie hidden under the Christmas tree. From inflation worries to geopolitical risks, we have been on a wild sleigh ride this past year. But whether you landed on the naughty or nice list this year depended on your ability to navigate the economic whiteouts caused by the likes of the Federal Reserve, Vladimir Putin, and Sam Bankman-Fried.


Tis’ the Season for Interest Rate Hikes

On the first day of Christmas, Federal Reserve Chairman stuffed my stocking with 7 rapid interest rate hikes. The Fed has been hiking the benchmark Federal Funds Rate at an unprecedented pace to combat high inflation which is causing concern among investors and consumers alike. As the cost of borrowing increases, whether it’s for a mortgage, car loan, or credit card, it impacts the affordability of goods and services for many households.  People tend to hunker down on spending and are less likely to take on new debt, which impacts aggregate consumer spending and business investment. Recently, the Federal Reserve raised its benchmark interest rate from 4.25% to 4.5% in its final policy meeting of the year. This marks the seventh consecutive increase in just nine months to the highest benchmark interest rate in 15 years.

The Federal Reserve has signaled its desire to keep interest rates higher through 2023 with the potential of rate easing, not until 2024. As a result of the Fed interest rate hikes, mortgage rates have reached 20-year highs, interest rates for home equity lines of credit are at 14-year highs, and car loan rates are at 11-year highs. Savers, on the other hand, are seeing the best bank deposit and bond yields since 2008. The 10-year U.S. Treasury yield hit a 12-year high in September at 3.93% causing foreign investment to flock to U.S. treasuries and spurring strength in the U.S. Dollar. After several years of low-yielding bond investments, investors are busily re-balancing their investment portfolios so they can much more safely jingle their way to their investment objectives.

Source: Statista


Dashing through Inflation

Santa’s pocketbook may be feeling a bit squeezed this gift-giving season as inflation continues to rage at the North Pole, particularly for the basic foodstuffs like milk and cookies. The Bureau of Labor Statistics reported earlier this month that the U.S. Consumer Price Index (CPI) saw a 7.1% increase year over year during the month of November, down from annual CPI of 7.7% in October and lower than the 7.3% increase forecast by economists. Importantly, the November monthly increase slowed to 0.1% and was driven into positive territory primarily by rising food (0.5%) and housing costs (0.6%). The PCE Prices Index due this Friday is the last consequential data release for the year. Other data this week mostly focuses on the housing market where home sales have slowed down, but actual prices continue to rise. Still rising housing costs are a problem for the Federal Reserve as “shelter” expenses account for the largest share of CPI. Housing cost increases have been slowing down and many economists believe gauges for both home prices and rents will start to show declines in the coming months.  The Fed’s owner’s equivalent rent measurement is a notorious lagging factor and when this statistic rolls over it may take a substantial bite out of headline inflation.  Supply chain backlogs, rising costs, government spending, labor shortages, and increasing demand have all played a part in elevating inflation to its current levels. As a result, these inflation trends have been the principal driver of the Federal Reserve’s aggressive hiking policy which has economists, investors, and consumers appropriately worried that a Fed-induced recessionary winter storm might be brewing as the Fed overshoots on the hawkish side.


Baby, it’s Looking like a Recession

Current economic pressure really can’t stay, baby, it’s looking like a recession. Recession fears are rising as investors lose confidence in U.S. economic performance in the face of an unprecedentedly rapid and yet unfinished Fed hiking cycle. Despite relatively strong economic growth in the third quarter of 2022 and a still low unemployment rate of 3.7%, the Federal Reserve has lowered its forecast for next year’s U.S. economic growth in light of its rate hikes and expects the unemployment rate to rise by the end of 2023 as well. Some believe that the current widespread concerns about a recession may help us avoid one, as caution leads to less risk-taking and borrowing, potentially cooling the economy enough to reduce inflation and the need for further interest rate hikes. Lagging inflation statistics remain elevated and central banks globally are continuing to raise interest rates to destroy demand and slow economic growth in the coming year. More real-time inflation measures, like the Cleveland Fed’s “Inflation Nowcasting” measure, show inflation moderating. Inflation Nowcasting’s fourth quarter run-rate CPI is at 3.5% and Core CPI (excluding food and energy) is at 4.7% suggesting the Fed is “fighting the last war” rather than anticipating what will happen next.


The U.S. Dollar All the Way

Santa’s reindeer are taking a new launch angle this year along with the U.S. dollar by soaring to new heights in 2022. The US Dollar Index, a measure of the dollar against a basket of other major global currencies, had been on the rise throughout 2022 but started to taper off in late November and December. Other central banks have joined the competitive rate-hiking game and compressed interest rate differentials. The strong dollar is beneficial for American consumers who purchase foreign goods, as it makes them cheaper in U.S. dollar terms. However, it can be an earnings headwind for American businesses that export goods or have multinational business operations such as McDonald’s and Apple. McDonald’s reported that its global revenue fell 3% this past summer due to the strong dollar as the rising costs of Big Macs have foreign consumers turning to other options. The strong dollar is also a reflection of the relative strength of the U.S. economy compared to other advanced economies, such as those in Europe (Euro) and Japan (Yen). Foreign investors flocking to higher and arguably lower-risk U.S. treasury yields only bolsters the dollar further.

U.S. Dollar Index; Source: Google Finance

Eat, Drink, & Spend like Consumers

U.S. consumers found themselves on the nice list in this year of profligate government spending. The US government gave consumers several nice stimulus checks due to the COVID-19 pandemic.  While some consumers used these relief funds to pay for day-to-day necessities, others have been able to enjoy new furniture, electronics, and vacations that have them saying “Mele Kalikimaka”.  Economists predict this holiday season may be the last fling of spending toward luxury brands and exotic travel. The current level of consumer spending is projected to dwindle towards the end of next year as recessionary fears manifest and unemployment levels grow as the Fed’s aggressive hiking policy takes hold.


It’s Beginning to Look a lot like a Labor Shortage

Santa may be having a bit of trouble finding enough elves to manufacture toys in his workshop this year. The COVID-19 pandemic brought about many changes to people’s lifestyles, and many re-evaluated their lifestyles as they were challenged with their mortality. Across the nation businesses in every sector are feeling the pressure to find enough skilled labor to meet the growing consumer demand for goods and services. In 2021, 47 million workers quit their jobs in what is referred to as the “Great Resignation.” The industries hurting the most are food services, manufacturing, & hospitality. Workers have signaled a desire for better company culture, work-life balance, and compensation. Some believe the labor shortage will work itself out if a recession were to occur.   However, others argue that this is just the beginning of secular labor shortages as declining birth rates in the U.S. and other developed nations have economists worried that we are not restocking the world’s workforce fast enough. Maybe Santa will be nice enough to supply us with some of his highly productive elves to bridge this gap until intelligent robotics develop further.

Source: US Chamber of Commerce


How Vladimir Putin Stole Ukraine

At the top of most of the world’s Christmas wish list is for the Russian-Ukrainian conflict to be resolved. Not only did the invasion of Ukraine in February bring about economic disruption but it has brought devastation to the Ukrainian and Russian people. It is estimated that close to 7,000 civilians in Ukraine have lost their lives in the conflict. The power-hungry, Russian Grinch Putin, is committed to overtaking Ukraine for strategic access to important trade routes and resources. Currently, Russia is occupying several major port areas along the Black Sea.  The Ukrainian defense has been putting up a strong fight with the help of $32 billion and growing of financial support from U.S. taxpayers.  Several trade restrictions and sanctions have been put into place to hurt Russia financially.  However, since Russia is the global largest energy supplier of natural gas and oil, these sanctions are only putting more extreme pressure on energy prices worldwide. Ukraine is also a large exporter of agricultural products, and the conflict has caused several production and logistics issues for Ukrainian farmers. Commodity prices have climbed as a result, particularly for wheat. While the conflict today looks unresolvable, maybe Grinch Putin’s heart will grow three sizes and he’ll decide to shower Who-ville with presents instead of artillery.  “Fahoo fores dahoo dores!”

Photo Source: Behance

Source: Wikipedia


Making Energy Bills Bright

As the war between Russia and Ukraine rages on, energy bills for people around the world continue to climb. Oil and natural gas prices have soared in 2022 with Europe being hit hardest by the jump given its deep dependence on Russian natural gas. In August, gas futures hit a record high of 350 euros creating immense pressure for European nations to set price limits on natural gas. Household electricity prices from natural gas-fired plants have increased in Europe by 67% in just one year, stopping some Europeans from lighting their Christmas trees this year. The European energy ministers imposed an electricity price cap this week to help lessen the burden on consumers. The United States has also felt the brunt of high energy prices as power prices rose almost 16%, the highest increase in 41 years. Consumers also felt the pressure at the gas pump as the average price of a gallon of gas rose to $4.96. Maybe in 2023, we can be like Santa and his reindeer-powered business model by running more of our economy on renewable energy.


Cryptocurrencies Roasting on an Open Fire

Cryptocurrencies roasting on an open fire, Sam Bankman-Fried nipping at your confidence. One of the largest cryptocurrency exchanges and hedge funds, FTX, filed for bankruptcy this November after information was released about its risky holdings and clandestine relationship with its affiliated hedge fund Alameda Research spooked many of its exchange customers. Several exchange customers sought to withdraw their crypto holdings from the FTX exchange, prompting the bankruptcy filing of the company.  It turns out FTX was another Ponzi scheme or con game with apparently none of FTX’s well-healed venture capital investors doing any due diligence or demanding a role in corporate governance. The price of Bitcoin has fallen 65% in the past year with investors losing confidence in an asset class imputatively regulated by the SEC and Commodities Futures Trading Commission (CFTC).  The CFTC has defined bitcoin as a commodity, but a turf war has continued with SEC creating regulatory uncertainty and ample opportunities for miscreants.  FTX was a Bermuda-based firm regulated by the Securities Commission of the Bahamas.  The SEC could have required crypto exchange registration and reporting and U.S. domestic incorporation.   Former FTX CEO, Sam Bankman-Fried, has agreed to extradition and will now be answering to the Justice Department and SEC for violations of wire fraud, money laundering, securities fraud, commodities fraud, and conspiracy to violate campaign finance laws. The once shiny wrapped package that was FTX Digital Markets now looks like a lump of coal.  Expect the naming rights for FTX Arena, home of the Miami Heat, to become available soon and most of FTX’s liberal political contributions to be returned to the bankruptcy court. Bernie Madoff will look like a petty thief compared to SBF.


Dreaming of Student Loan Forgiveness

About 43 million Americans received a nice Christmas present from President Biden this year, with forgiveness for part of their $1.6 trillion student loan debt. President Biden announced the plan earlier this year sparking both joy for recipients and scrutiny from every other U.S. citizen. The plan would eliminate $10,000 in federal loans for individual borrowers making less than $125,000 per year or couples earning less than $250,000 annually. Pell Grant recipients, which account for 60% of current student debt holders, could receive upwards of $20,000 in forgiveness. However, this largesse begs the question of where the money for this forgiveness will come from as the US government already is $31 trillion in debt.  Biden’s Executive Order faces many legal challenges in Congress and the Supreme Court to overcome and move this profligate effort forward.


All I Want for Christmas is Farmland

The bright star on top of the investment tree this year is an asset class that has been at the top of many institutional investors’ Christmas wish lists all year, U.S. farmland. Farmland hasn’t always been seen as an accessible investment option.  However, farmland funds such as Promised Land Opportunity Zone Fund and others have been formed to allow investors access to in this durable, inflation-beneficiary asset class. Iowa State University recently reported farmland values in Iowa were up 17% in 2022 which comes on top of a 29% increase in 2021. Similar stories have been reported throughout the Midwest as strong commodity prices fuel farm incomes and transacted land values. The COVID-19 pandemic had people re-evaluating what is important to our world with basic human needs, like food, at the top of the list. While consumer preferences and social trends may change, people will still need to eat, making farmland one of the most durable asset classes through time. This has many investors saying “All I Want for Christmas is Farmland.”


We Wish You a Diversified Portfolio

At Servant Financial, our goal is to help you navigate these turbulent times and help you make the best decisions for your investment portfolio. We understand increased market volatility may be causing investor unease, but it is times like these that the basic investment principle of portfolio diversification proves its mettle.  With inflation still a concern and US treasuries on the rise, we are paying close attention to iShares 0–5-year TIPS Bond ETF, STIP. With low management fees (.03%) and a 30-day SEC yield of 5.84%, its 2.5-year duration could be an ideal addition to a blended debt and equity portfolio.  The principal value of TIPS (upon which the stated interest is paid) is adjusted semiannually as inflation rises, as measured by CPI.  STIP holds a variety of U.S. treasuries with maturities of less than 5 years protecting you against rising interest rates and inflation.  STIP is a core holding of Servant’s risk-based client portfolios.


Happy Holiday’s from your friends at Servant Financial and we wish you a globally diversified portfolio.  

Instead of holiday cards or gifts, Servant Financial will be making an annual contribution on behalf of clients and friends to Mercy Home for Boys & Girls.

May this holiday season be a time of rich blessings for you and your family.

Source: Pinterest

white-arrow