Email us at info@servantfinancial.com to talk to a financial advisor today!

Email us at info@servantfinancial.com

Carbon-Nation: Intro to Carbon Markets

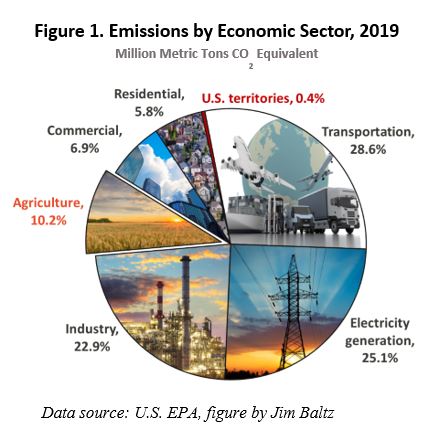
Although agriculture is the fourth leading source of greenhouse gas emissions (see Figure 1), agricultural land also has the unique ability to store carbon dioxide in soils, plants, and trees. Because of this unique ability, recently, there has been a lot of focus on agriculture as a way to reduce greenhouse gas emissions. One report suggests that U.S. agriculture and forestry sectors can provide 10-20% of the sequestration and emission reductions needed to reach net-zero emissions by 2050. Current carbon sequestration on U.S. cropland is 8.4 million metric tons of carbon dioxide equivalents  per year (“CO2–eq  per year”) and the estimated annual sequestration potential is 100 million metric tons of CO2–eq  per year (source).

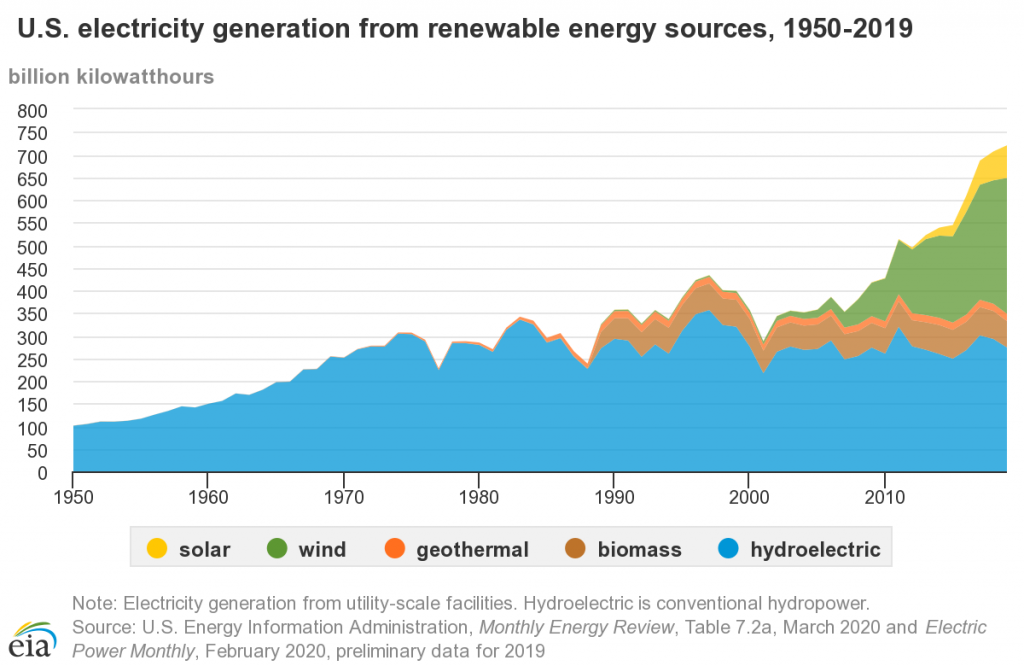
When considering the chart of emissions by economic sector, we see the three largest emitters are the transportation, electricity generation, and industry sectors. These three sectors alone account for approximately 77% of the total U.S. greenhouse gas emissions. Reducing emissions in these sectors typically requires long-term changes. For example, a shift toward electric cars in the transportation industry or solar or wind power in the electricity generation industry requires infrastructure changes and technology shifts, which have long lead times. One advantage of agriculture is its ability to make changes relatively quickly compared to the other larger emitting sectors. Within one growing season, farmers can adopt a practice such as cover crops or no-till that sequesters significant carbon and reduces greenhouse gases.

Several traditional agricultural seed and input companies and emerging agricultural technology (“agtech”) companies have been working to quantify and monetize the environmental benefits of agriculture. These agtech companies have begun launching private agricultural carbon markets for farmers.   Farmers can enroll their acres and adopt new practices that sequester carbon in the soil such as planting cover crops, adopting no-till or reducing their tillage, or reducing their nitrogen application. The sale of carbon credits presents an opportunity for farmers to receive financial benefits from changing to more environmentally beneficial agricultural practices, although carbon prices offered to farmers may not currently be high enough to cover their cost of switching practices. Information about carbon markets can be opaque and challenging to navigate because each carbon company typically has a different structure for payments, verification, and data ownership.  Many farmers are skeptical of these unregulated, “market” based programs.


Why Now?

The increased interest agricultural carbon markets stems from President Biden’s Executive Order on Tackling the Climate Crisis at Home and Abroad from January 27, 2021. This order specifically mentions “America’s farmers, ranchers, and forest landowners have an important role to play in combating the climate crisis and reducing greenhouse gas emissions, by sequestering carbon in soils, grasses, trees, and other vegetation and sourcing sustainable bioproducts and fuels.” As part of this executive order, the USDA collected input from the public about how to encourage the voluntary adoption of climate-smart agricultural and forestry practices. Stakeholders were also requested to make specific recommendations to the USDA for an agricultural and forestry climate strategy. The result of this initiative is the recent announcement by the USDA to use the Commodity Credit Corporation (CCC) to invest $1 billion in funding for pilot programs that use climate-smart practices and develop methodologies and practices to accurately and efficiently measure the greenhouse gas benefits4.

Chicago Climate Exchange (CCX)

Previously, there was a greenhouse gas reduction and trading project for emission sources and offset projects that could also be used for agriculture. The Chicago Climate Exchange (CCX) was a stock exchange for emission sources and offset projects that traded carbon credits from 2003 to 2010 (source). Some ways farmers could participate in CCX were through soil best management practices (continuous conservation tillage and grazing land best management practices), methane capture and destruction, reforestation, and fuel switching. In 2009, the CCX had over 9,000 farmers and ranchers enrolled, covering 16 million acres (source).

One significant challenge the previous CCX platform faced was a greater supply of carbon sequestration practices than market demand, driving down the price of credits. Today, the situation and market structure may be completely different. One-fifth of the world’s largest publicly listed companies have announced net-zero emissions targets. Furthermore, the U.S. has also pledged to reach net zero emissions by 2050. Some companies who purchase agricultural goods may need to specifically reduce their scope 3 emissions, which are the indirect emissions contained in the goods. For example, if a company purchases corn, the scope 3 emissions are emissions that went into producing the corn, such as fertilizer and fuel. One example of a company who purchased agricultural carbon credits is Microsoft, who purchased $2 million in carbon credits from Truterra, a subsidiary of the U.S. farmer cooperative Land O’Lakes in 2021. The new policy initiatives and public sector investment in climate smart agriculture by the USDA may catatlyze the market for agricultural carbon credits by providing more regulatory structural certainty for the carbon market today compared to the past.

How Farmers Participate

The main way farmers participate in agricultural carbon markets is through private companies who help farmers produce, verify, and sell carbon offsets in a marketplace or directly pay farmers for adopting new practices. Some select agricultural carbon market programs are shown below:

These companies typically use an estimation model to estimate the change in a farmer’s soil carbon from adopting a new practice and then pay the farmer based on this change. Many companies also use periodic soil testing in conjunction with modeling to verify results. Typically, most companies are guaranteeing farmers a minimum of $15 to $20 per carbon credit, where a credit is equal to one metric ton of CO2–eq. Many carbon industry experts are projecting that price to go up to $30 per credit in the upcoming year based on projected demand growth for carbon.

Opportunities for Carbon Market Investment

Although there is not a specific investment offering for agricultural carbon markets yet, there are broad-based carbon markets available that could indirectly affect those who own and invest in farmland. The opportunity of landowners and farmers to participate in these private agricultural carbon markets could generate some extra revenue on the farm, especially if carbon credit prices increase. More broadly, there are already existing opportunities for farmers, landowners, and environmentally conscious investors to allocate capital to carbon allowance ETFs.

Regulators across the globe are experimenting with policies to try force a transition to more renewable energy sources while attempting to minimize the economic fallout.  One such policy tool is carbon taxation and the associated carbon credit (or allowance) market prevalent in the European Union (EU).  One carbon allowance allows a firm to emit one metric ton of CO2. These allowances are auctioned off by the governing body that oversees the emissions trading system (ETS) and major carbon emitters are forced to buy an allotment of allowances equivalent to their estimated CO2 emissions. As all carbon emitters in a particular region need to buy these credits, the market sets a price based on the demand for fossil fuels and the restricted supply of carbon allowances.

Major markets have been established for carbon allowances in Europe, the United States, Asia and Australia. In the aggregate, it is estimated that the total size of these markets has reached $600 billion in 2021. The largest market is the EU ETS, which governs the 27 EU member states plus Iceland, Liechtenstein, and Norway and accounts for 41% of the EU’s greenhouse gas emissions. There are four carbon allowance ETFs available at this time –  KraneShares Global Carbon Strategy ETF (KRBN) (link), KraneShares California Carbon Allowance Strategy ETF (KCCA), KraneShares European Carbon Allowance Strategy ETF (KEUA), and iPath Series B Carbon ETA (GRN).

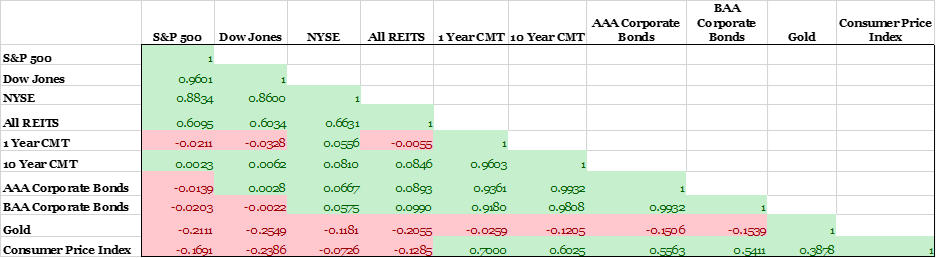
The largest and most liquid ETF KRBN tracks the major European and North American cap-and-trade programs (European Union Allowances (EUA), California Carbon Allowances (CCA) and the Regional Greenhouse Gas Initiative (RGGI) emission trading systems.  KRBN ETF’s assets total $1.8 billion.

The following chart summarizes the historical performance of KRBN ETF versus West Texas Intermediate crude (WTI) and All Country World Equity Index (ACWI).

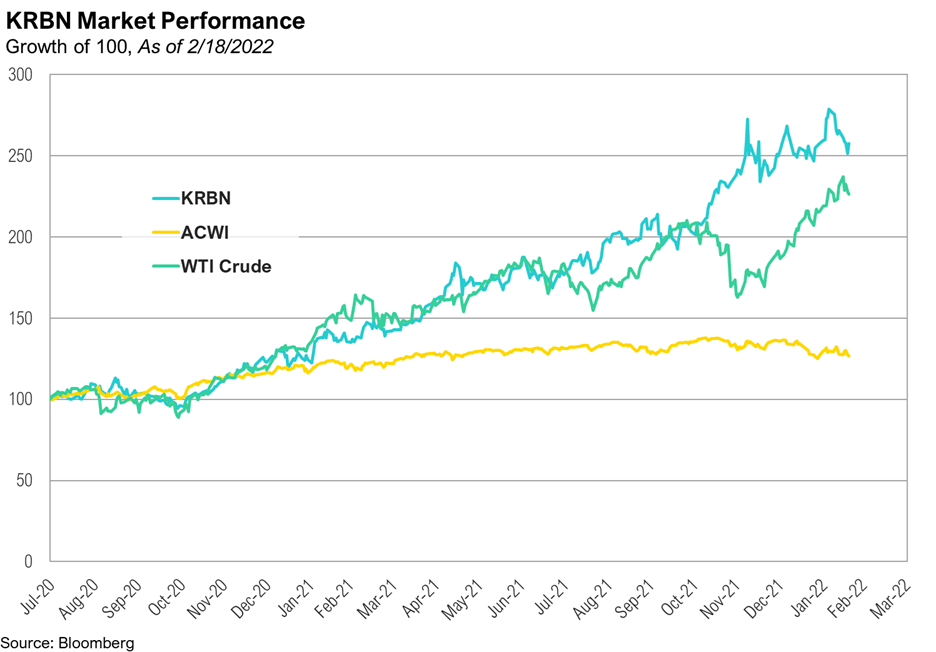
Servant Financial has no formal recommendation on KRBN at this time given the volatile inflation and energy market dynamics and the Ukraine war.  In particular, the EU dependence on Russian oil and gas makes for a potential backdrop for easing of environmental standards to alleviate populous backlash on rising energy costs.  An allocation to KRBN may be a suitable consideration for more risk tolerant investors wishing to invest with purpose in an environmentally more sustainable planet for future generations.

Going, Going, Gone! Is Inflation Running Away with our Money and our Investment Returns?

On the field that is the U.S. economy, currently loading the bases are looming interest rate hikes, the value of the U.S. dollar, and rising Treasury yields. On the mound, is Federal Reserve Chairman, Jerome Powell, and everyone from investors to consumers are waiting to see what will happen next with monetary policy and the economy. Early in the game, the COVID-19 pandemic threw a curveball, and ever since, the economy has been dribbling a series of weak grounders from persistent unemployment, to supply chain disruptions and a declining labor force participation rate. Will Chairman Powell toe the rubber to strike out runaway inflation and imperil economic growth or is the US economy in for extra innings?

How did inflation get so out of hand?

The U.S. Bureau of Labor Statistics reported that in January 2022, the consumer price index rose 7.5% from January 2021, the highest rate of inflation since February of 1982. Some of the industries seeing the largest price hikes are the energy, gasoline, housing, and food sectors which is of no surprise for anyone who has bought groceries or visited the gas pump lately. Even with the rise in prices, it hasn’t generally stopped consumers from spending. The Commerce Department reported that retail sales are up 3.8% year over year with large gains reported in vehicle, furniture, and building supply purchases. Home sales have been on the rise as well with the National Association of Realtors citing that home sales in January were up 6.7% from the previous month. This comes as home buyers are trying to secure financing at lower interest rates before the anticipated Federal Reserve rate increase next month.

Source: SpringTide US. Inflation Trends

While this level of inflation is unlike anything Americans born after the 1970s and early ‘80s have ever experienced, many economists are not surprised by this spike in the CPI. The federal government has shelled out more than $3.5 trillion in COVID-19 relief funding in the form of stimulus checks, unemployment compensation, and the paycheck protection program. The figure below shows the allocation of this spending with more spending earmarked through 2030 as the government continues to combat the aftershocks of the pandemic. The excess liquidity in the market, combined with the supply chain disruptions and labor shortages, has created the perfect cocktail for inflation to brew. While this spending was necessary to keep the economy out of a recession, some argue the federal reserve hasn’t been aggressive enough in unwinding its pandemic era policies to combat rising inflation. The Federal Reserve has announced that rates will start to rise in March, but by how much? Experts, such as economists at Citibank, are predicting anywhere from a 25 to 50-basis point hike with the later end of the spectrum becoming more likely as inflation rises. They are then expecting three to four more 25-basis point hikes by the end of 2022. Economists feel this could help slow inflation by the end of the year, but supply chain disruptions and incipient wage inflation risk still loom.

Source: CNBC analysis of Treasury data compiled by the Pandemic Response Accountability Committee

Is 2022, the new 1980?

The survivors of the last battle with inflation in the 1970s and 80s know all too well what runaway inflation looks like.  It has some questioning whether we are in for a blast from the past in 2022. Inflation peaked in 1980 at 14.8% and while we haven’t hit those levels yet, the jump we have experienced has people on their toes for a line drive heading for them. Inflation in the ’80s was driven by a variety of factors from unpredictability in interest rates to soaring oil prices. Most economists believe that this time is different than the 1980s as recent inflation has been caused by COVID-19 aftershocks of excess liquidity and supply chain issues. These factors are expected to normalize over time.

Examining our Investment Strategy

Markets have been off to a shaky start in 2022 with inflation and geopolitical risks in Russia & Ukraine driving the recent volatility. Economists and investors worry that if war broke out between Ukraine and Russia, it could cause more supply chain disruptions of commodities which could prolong inflation. While the Federal Reserve’s announcement of a March interest rate increase has curbed some concerns about more inflation, these new geopolitical risks could overshadow efforts to reduce inflation through monetary policy. As a result, investors are watching markets closely in addition to exploring inflation-protected physical assets such as gold or farmland. Below is the historical correlation between several asset classes and the consumer price index using returns data from 1970-2020. The CPI has historically had a positive relationship with bonds and precious metals but a negative relationship with equities.

Source: Data supplied by the TIAA Center for Farmland Research

Physical assets such as precious metals and farmland have taken center stage the past few months with gold values up 5.3% year to date and farmland values up 22% in parts of the Midwest since this time last year. While these physical assets have been investors’ go-to during high inflationary periods in the past, investors have also been allocating more of their portfolios to cryptocurrencies as well. Cryptocurrencies have a relatively short history compared to traditional assets which makes it difficult to analyze their performance with inflation, however, some investors are calling it “digital gold.” Even Mr. Wonderful, Kevin O’Leary, claims that his portfolio has more holdings in cryptocurrencies now than gold. Crypto enthusiasts cite its ability to be shielded from the effects of government money printing and spending largesse.

Servant Financial has been keeping tabs on inflation and has updated its investing strategy accordingly based on investors’ risk tolerance. While we are still allocating a portion of portfolios to equities and fixed income instruments, we’ve had a higher portfolio tilt towards allocation to precious metals, real assets, and Grayscale Bitcoin Trust (BTC) as protection for client portfolios from inflation. INFL, Horizon Kinetics Inflation Beneficiaries ETF, has recently been added to the portfolio as well. It is an actively managed ETF designed to capitalize on growing inflation trends. Currently, INFL has $896 million assets under management with holdings in transportation, financial exchanges, energy and food infrastructure, real estate, and mining companies. While INFL has a diverse group of global holdings, its top holdings are in PrairieSky Royalty (Oil & Gas), Archer Daniels Midland (Food & Agribusiness Processing), and Viper Energy Partners (Oil & Minerals).

While inflation has threatened investors’ portfolio returns, an adjustment in investment strategy for the purposes of inflation hedging will help investors score in the performance game in the later innings of this economic cycle. A watchful eye must be kept on key economic signals such as changes in interest rates, inflation trends globally, and the supply chain normalization. If you would like to discuss your asset allocation so you can do well in all facets of the investment game like the alert and observant Willie Mays, the Say Hey Kid (Say who. Say what. Say where. Say hey.), contact Servant Financial today.

Organic Agriculture: Fad or Durable Trend?

Background on Organic Agriculture

Walking down the aisle of the grocery store, a shopper can find a variety of different food labels attempting to win their attention such as “No Added Sugars”, “Gluten-Free”, or “No Artificial Dyes or Flavors.” More recently, labels such as the one below have been popping up in grocery stores across the U.S.

 USDA Organic Seal

It used to be that organic products were only found in select stores that specialized in organic or sustainable food products, but more and more organic products are going mainstream and can be found in big-name grocery stores such as Walmart, Costco, and Target. In fact, Walmart, is the #1 seller of organic products offering more than 400 different organic products. That figure surprises some people that expect traditional specialty stores such as Whole Foods or Trader Joes to dominate the space, but the market share of Walmart outpaces both of these popular organic store chains.

But what actually constitutes a product as organic? While this definition could be different based on who you ask, the Environmental Protection Agency defines “organically grown” as food that is grown and processed without synthetic fertilizers or pesticides. However, natural pesticides that are derived from animals, plants, bacteria, or minerals are allowed. Organic production has been taking place in the United States since the 1940s but it started to gain steam in the 1970s as consumers demanded more environmental awareness and became increasingly concerned about how food was grown. In 1990, Congress passed the Organic Foods Production Act to develop national standards around organic production in both livestock and crop production. The National Organic Program which is a marketing program managed by the USDA aims to create and monitor uniform standards around organically produced products to aid consumers in their decision-making.

Drivers for Organic Products

Organic sales currently account for more than 4% of total U.S. Food Sales and that number is projected to continue rising in the future. Total sales of organic products grew 31% from 2016 to 2019 domestically and are projected to grow at a compound annual growth rate of 10% through 2025. The dominant organic product in the U.S. market is fruits and vegetables with large growth in 2020 in the pantry stocking and meat, poultry, and fish sectors.

Organic sales are on the uptick with sales reaching $56 billion in 2020.

While there are a variety of factors driving organic food demand such as environmental or health concerns, the largest reason is consumer preference and affordability. Historically, organic products cost anywhere from 10-50% more than conventional products. When it comes to one of the U.S. largest agricultural exports, corn, the price of organic corn is more than double its conventional counterpart. Organic production is more costly for producers.  In addition to higher seed and land costs, producers face a costly 3-year transition period in the land to become certified organic. During this time, the land must be “cleansed” of any conventional pesticides or fertilizer. Once a farm is deemed USDA certified organic, the returns are considerably higher than conventional methods for corn and soybeans in particular. The table below from the USDA presents data that shows that although organic production costs are higher than conventional costs, the higher prices received for organic crops more than offsets the higher production costs for corn and soybeans.  The same can also be said for organic meats and produce however there is less widely available information about those markets.

While the costs of organic production are higher, this is offset by higher prices received.

After investigating the returns to organic production, you might ask, why aren’t more farmers producing organic products? The biggest hurdle for farmers is the three year transition period and capital expenditures needed to become organic. The three-year transition can cause a financial hit to producers that can be difficult to recover from. Another difficulty for organic producers is the lack of infrastructure in the organic industry. Unlike, conventional products like corn and soybeans, there is not a centralized market such as an exchange for organic products to be bought and sold. Organic products often require more specialized handling and storage and there are not as many facilities able to handle these needs. While government policy is working to change this, there is much work to be done in this space if the U.S. is to meet its own domestic demand for organic products.

Investment in Organic Agriculture

An investment in organic agriculture could be attractive for investors not only in investment performance but also may fit their preferences to actively support environmental, social, and governance (ESG) standards. Many organic companies share these beliefs and would seek to leverage capital from ESG investors to transform and grow the organic marketplace and infrastructure. Investors looking to capitalize on organic investing have a variety of options. They could invest in the common stock of companies selling organic products such as WhiteWave Food (WWAV) which owns 4.2% of the organic market share with popular brands such as Horizon Organic. In 2017, WhiteWave Food was acquired by Danone, one of the largest multinational food companies.

Another common stock option could be to invest directly in organic grocers such as Sprouts Farmers Market (SFM) which specializes in premium organic foods and performed quite well against large grocery competitors during the COVID-19 pandemic. Sprouts delivers a unique farmers market experience with an open footprint of fresh produce at the heart of the store and welcoming look and community feel.  Sprouts offers an assortment of fresh, high quality food that is sought after by its more affluent and educated consumers. Because they are able to capitalize on health and quality conscience consumer base, their profit margin is 4.5% which is strong compared to one of the largest grocery stores in the U.S., Walmart, who has a profit margin of 1.4%. Sprouts’ ESG operating focus has also impressed its stakeholders, particularly its efforts to reduce food waste by 78,000 tons.  Sprouts has an equity market cap of $3.2 Billion and trades at a reasonable 11 times trailing twelve month earnings.  Sprouts is ramping its growth plans and intends to add 300 – 400 new stores in expansion markets of Texas, Florida, California, and New England.

In last month’s article, we discussed the Promised Land Opportunity Zone Fund which provides investors the opportunity to deploy capital in farmland which has historically provided strong returns with inflation hedging capabilities. The farmland in this fund lies within an opportunity zone, providing tax benefits to investors. The Promised Land Opportunity Zone Fund is looking to deploy capital to organic conversions in opportunity zones as part of its broader opportunity zone investment in farmland. If you are interested in learning more about the Promised Land Opportunity Zone Fund, please contact Ethan Rhee at ethan@servantfinancial.com.

Another option for investment in a private fund that is more of a pure play in the production of organic food, an investor could invest in an organic farmland REIT such as the Vital Farmland REIT LLC (Fund II) managed by Farmland LP. Farmland LP’s has assets under management valued at more than $200 million across its two farmland funds, totaling close to 15,000 acres. Farmland LP earned the highest corporate sustainability rating by HIP Invest Inc. in 2021 for its ESG efforts.

For ETF investors, there are fewer options for direct organic investment however several ETFs are investing in food production and food processing. The First Trust Nasdaq Food & Beverage ETF (FTXG) has $6.4 AUM and also has a AAA rating (best) for ESG impact by Morgan Stanley Capital International. Their primary holdings are in food processors such as Bunge, Tyson, Archer-Daniels-Midland, and General Mills. These companies are all making significant strides towards increasing processing capabilities for organic products.

While organic agriculture has made substantial advances in the past ten years, this emerging agricultural sub-sector is still in need of capital to grow productive capacity and reach its full potential. An investment in organic food production provides for diversity of consumer preferences as well as environmental and sustainable production benefits for American farmers and farming communities. The historical and projected organic sales data and savvy investor capital flows suggest that organic agriculture is a durable trend that is here to stay.

One Up On Main Street – A Farmer’s Daughter’s Guide to Farmland Investing

Author’s Note

“This past month, I defended my master’s thesis on the Role of Farmland in a Mixed Asset Investment Portfolio. Under the direction of Dr. Bruce Sherrick at the University of Illinois at Urbana-Champaign, I explored how an investment in farmland can interact in an investment portfolio of equities, bonds, and treasuries in addition to how it can hedge against inflation. Using data maintained by Dr. Sherrick and courtesy of the TIAA Center for Farmland Research, I analyzed the returns to farmland from 1970-2020 and some of my results are discussed below in addition to introducing farmland as an asset class to institutional and individual investors.” – Ailie

Background on US Farmland

Farmland is a unique asset class in that it has a limited supply and potentially an unlimited useful life. Only 17.2% of the United States landmass is considered arable.  With a growing world population projected to reach 9.7 billion by the year 2050, farmland is well positioned as a production source for a basic human need: food. Not only is the population rising but income levels are also expected to follow suit with world GDP projected to double by 2050. These statistics suggest that demand for food is going to go up and the composition of caloric intake is expected to change. Research shows that protein consumption rises with rising income levels.  With a significant portion of farmland acres dedicated to either feeding livestock or producing other protein sources like chickpeas or lentils, farmland owners and operators are uniquely positioned to meet this demand and profit from it. So long as humanity needs food, there will be economic rewards for the cultivators and landowners.

Farm Balance Sheet

If an institutional or individual investor was investing in a company’s common stock or buying a corporate bond, they would typically examine the balance sheet of the company. The same is true for investing in farmland. Farmland has grown in value significantly over the last 50 years with a 55% increase in the last 10 years alone. Farmland (Real Estate in the table below) dominated the asset side of the farm sector’s balance sheet encompassing close to 83% of total assets. Under the recent low-interest-rate environment, farmland’s debt level has also grown but this is still significantly less than the portion of farm assets it supports. The overall low debt to equity ratio of 16.2% demonstrates a very conservative leverage position relative to other real asset sectors and the relative strength of the U.S. Agriculture industry as a whole.

Data maintained by the TIAA Center for Farmland Research based on data from the Economic Research Service, a sector of the USDA

Returns to Farmland

Like any real estate asset, farmland receives returns when held by an investor in two ways: appreciation in value and cash flow generated from rental income. In 2021, the U.S has experienced a rise in both. According to the USDA, farmland prices are up 8% from last year.  Record sales prices of farmland have been occurring throughout the U. S.’s key growing regions.

August 2021 USDA Land Values Summary

On the rental income side, most investors would be participating in a straight cash rent system meaning a farmer pays the landowner a fixed amount per year for the use of the land. Recently, the U.S. has experienced growth in cash rent values along with the rise in farmland prices.  Fueled by strong commodity prices, healthy farming profits, and appreciating land value, cash rental rates are projected to rise 10% in 2022.

To examine a longer-term horizon of historical returns to farmland, data from the TIAA Center for Farmland Research was utilized from the years 1970-2020. During this period, the average return to all U.S farmland was 9.7% with a standard deviation of 6.4%. This composite return encompasses all 50 states.   However, not all regions of the U.S. are suitable for farming or have optimal productivity. An institutional investor also has to consider that that are nine anti-corporate farming states that would make it difficult for them to invest in certain key production states like Iowa.

One way for an investor to maximize their potential returns while gaining operational efficiencies from scale is to invest in a farmland fund that provides broad diversification with farms in several key states. The Promised Land Opportunity Zone Fund (“PLOZ” or “Promised Land”) is one way for investors to capitalize on the durable returns of U.S. farmland while also receiving favorable tax benefits such as a reduced capital gain taxes depending on how long the asset is held. The government defines opportunity zones as urban and rural communities that need significant investment to foster economic revitalization. The current PLOZ portfolio is managed by Farmland Partners in conjunction with Servant Financials’ founder, John Heneghan. Currently Promised Land owns 10 properties of 8,000 acres in North Carolina, South Carolina, Illinois, and Mississippi. These states encompass some of the highest performing states in the U.S.

Using this state composite for Promised Land, the weighted average return of states represented in the fund can be used as a proxy to compare farmland returns with other traditional investments. This is done by weighting the allocation to each of the 5 states by purchase price then finding the average return of these states using the TIAA Center for Farmland Research’s data on cropland return. The return from 1970-2021 across the Promised Land proxy states was 11.1% with a standard deviation of 8.4%. Looking at the more recent term, this farmland proxy had a return of 8.2% with a lower standard deviation of 5.2%.

Note: This analysis uses USDA state-level averages to compare historical returns and does not necessarily represent the returns that an investor would achieve with an allocation to the Promised Land Opportunity Zone Fund.

Relationship of Farmland with Traditional Investments

The proxy returns in the Promised Land Opportunity Zone Fund can be compared with other traditional assets such as corporate bonds, stock indices, REITS (real estate investment trusts), treasuries, and gold. Using a risk-return plot under two different time horizons, the position of farmland as an investment can be compared with other investments. Performance metrics from 1970-2020 were examined to show farmland as a longer-term investment compared to a shorter time horizon of 2000-2020. See the figures below for full details.

Data maintained by the TIAA Center for Farmland Research.

The Promised Land OZ proxy demonstrated the highest risk-adjusted return compared to the other asset classes over both time periods.  PLOZ has the optimal position in the upper left-hand quadrant of the graph with a high return and overall lower risk compared to equities, REITS, and gold. Even in the last 20 years, the PLOZ proxy still yielded high, relative returns with lower risk.

The relationship between farmland and other investments can be further compared by examining the correlation of returns in the chart below.  A value of 1 means two asset classes are perfectly correlated and would be expected to move up or down in tandem.  A negative number suggests the two assets move in the opposite direction over time.

Promised Land’s negative correlation with stocks (S&P 500, Dow Jones, NYSE) gives reason to believe that farmland would provide diversification benefits and offset some of the volatility of these assets with high standard deviations (risk measure). In the more recent past (2000-2020), farmland’s negative relationship with stocks is even stronger with a -.32 correlation with the S&P 500. Note that when the S&P 500 dropped 48.6% in 2008 after the great recession, the Promised Land proxy maintained a positive return of 8.9%.

Relationship of Farmland with Inflation

Recently, investors have been concerned about inflation and how they will affect investment portfolios.  The Labor Department recently reported that inflation had hit a 31-year high in October with the consumer price index (CPI) rising to 6.2%. Investors and economists across the globe are wondering if we are witnessing the death of Fed’s “inflation is transitory” narrative.  Historically, stock indices have had a negative correlation with inflation and investors are concerned that these inflationary trends are long-term and secular in nature. Farmland on the other hand has historically provided a nice hedge against times of inflationary pressure. Examining the PLOZ proxy returns with CPI trends shows a positive correlation of .71, meaning historically an increase in the CPI will also increase returns to farmland. Recently this trend has held as some Midwest land is up 20% in value along with the higher consumer prices. See the figure below for more details.

Investment Opportunities

With its potential return and diversification benefits along with its track record as an inflationary hedge, farmland is positioned well to have a complimentary role in a traditional 60/40 (equity/bonds) investment portfolio. To optimize on this potential, investors have a few different options to partake in farmland investing. The most obvious option is to buy farmland directly.   However, this could be costly and comes with the requirement that the investor find capable management for the parcel. Buying a single parcel of farmland also puts the investor at more risk that comes from regional concerns like weather or farm-level (or idiosyncratic) risks like loss of production due to water or soil nutrient levels.

To alleviate some of the parcel management burden while still participate in farmland’s return and diversification benefits could be to invest in the Promised Land Opportunity Zone Fund. The fund is targeting internal rates of return between 8% and 14%, before consideration of the tax benefits it would provide to OZ investors. PLOZ’s mission is to help investors and agricultural communities achieve mutually beneficial outcomes through profitable, durable investing in farmland and the revitalization of rural American communities.  In addition to its core “opportunity zone” impact, Promised Land is evaluating other environmental, social, and governance (ESG) principles, such as farmland preservation, wetland and forestland restoration, organic conversions, and soil health and carbon management practices.  Promised Land’s vision is for these agricultural communities to prosper by feeding the world while OZ investors do well by doing good for these communities and the environment.  If you are interested in learning more about the Promised Land Opportunity Zone Fund, please contact Ethan Rhee at ethan@servantfinancial.com.

Another option for investors would be to invest in Promised Land’s partner: Farmland Partners Inc. Farmland Partners Inc. (FPI) is a publicly traded company that acquires and manages high quality farmland throughout North America. FPI manages the farmland in the Promised Land Opportunity Zone Fund as well. FPI’s current portfolio consists of 157,000 acres in 16 different states. Currently FPI’s stock is trading for just over $12 per share which is up 50% from this time last year. We believe this is an attractive entry point below the fair value of the farmland that FPI owns.   On their third quarter 2021 earnings call, CEO Paul Pittman, commented that the net asset value of the farmland was closer to $14-$15 per share. FPI has also restarted its growth and consolidation strategy.  In addition to direct farmland acquisitions, FPI is growing its asset management business with its property management arrangement with Promised Land and its recent acquisition of Murray Wise & Associates.

With the risk of secular inflation on the rise and the inherent portfolio diversification, an investment in farmland is something all investors should be considering. By including an allocation to farmland in your investment portfolio, you’ll have a much more efficient portfolio and be “one up on Main Street” investors enamored with a traditional 60/40 investment portfolio.

Soak Up the Sun — Investing in Solar Power

Solar photovoltaic (PV) energy is 2020’s fastest growing renewable energy source. According to the National Renewable Energy Laboratory, the United States installed a record-high 7.2 gigawatts (GW) of direct current PV in the first half (H1) of 2020, up 48% from H1 in 2019. Gains in the solar industry are making PV power sources increasingly competitive with fossil fuels.

The solar utility sector saw more growth than the commercial and residentials sectors in 2020. Solar in the utility sector saw 89% year-over-year growth in H1 2020. Commercial sector PV installations decreased 14% and residential PV installations were relatively flat. 

Almost 60% of US PV capacity installments this year took place in California, Texas, and Florida. Environment America’s Shining Cities 2020 report found Honolulu has the highest solar PV installed per capita, with 840.88 watts per person in 2019. Los Angeles leads the nation in total installed solar PV capacity, with 483.8 MW by the end of 2019. 

Solar energy provided about 2% of the total electricity produced in the United States in 2019. Last year, the solar industry employed around 250,000 people and generated $18.7 billion of investment in the U.S. economy. The country has over 85 GW of installed solar capacity, enough to power 16 million homes. 

U.S. electricity generation from renewable sources
U.S. Energy Information Administration

Solar power is now one of the cheapest sources of electricity. In the past decade, the solar industry has seen a 90% drop in the cost of solar modules. From 2010 to 2019, electricity costs from large-scale solar PV installations dropped from about $0.38 per kilowatt-hour to $0.07 per kilowatt-hour. 

Despite higher upfront installation costs, solar power is less expensive than carbon-based power in the long-run. The cost of a residential solar system depends on its geographic location, size, and brand. Installed residential solar systems in the U.S. have an average price of $2.57 per watt and total costs ranging from $10,250 to $12,528 after the solar Investment Tax Credit (ITC)

The ITC is a 26% tax credit for solar systems on residential and commercial properties. Since the implementation of the ITC in 2006, the U.S. solar industry grew by more than 10,000%. Furthermore, the industry saw an average annual growth of 50% over the last decade alone.

U.S. tariff policy also plays an important role in the success of the solar industry. According to the Congressional Research Service, 98% of solar cell and module production occurs outside of the United States. The cost of imported panels has decreased significantly, enabling record-high levels of solar imports despite continued tariffs: 14.2 GW of PV modules and 1.3 GW of PV cells in H1 2020.

These leading five markets collectively installed 24 GW of PV in the first half of 2020, approximately the same level as in 2019 (NREL 2020 Solar Industry Update)

Gains for solar in the early 2020 stock market diminished with the COVID-19 induced economic downturn in March. At the time, the solar sector experienced stronger than expected demand and good financial performance from companies. Consequently, solar stocks outperformed the rest of the market.

According to the MAC Global Solar Energy Stock Index, solar stocks bounced back since spring 2020 due to affordability, the viability of solar-plus-storage, and Joe Biden’s apparent presidential victory and clean energy agenda. Bloomberg New Energy Finance (BNEF) forecasted U.S. solar installs in 2020 will grow by +21% to 13.4 GW.

The Invesco Solar ETF (TAN) represents  solar stock performance very well. In September 2020, TAN outperformed the broader market with a total return of 77.3% over the past year. In comparison, the Russell 1000 Index saw a total return of 13.8%. Expectations about Joe Biden’s election victory and increased investment in renewable energy drove TAN up over 120% from the beginning of 2020 to date.  

Sunrun (RUN) and Tesla (TSLA) are the largest solar installation companies in the United States. Sunrun spiked over 300% this year and acquired Vivint Solar for $3.2 billion in July a deal that merged the nation’s two largest rooftop solar companies. 

Companies' % of Residential Installs
Source: Corporate filing, SEIA/Wood Mackenzie Solar Market Insight Q3 2020 (NREL 2020 Solar Industry Update)

In June 2020, Tesla announced they will deliver the lowest price for solar of any national provider with a price-match guarantee. The company currently charges $1.49 per watt of solar on existing roofs and installed over 3.6 GW of clean solar energy across 400,000 roofs—the equivalent of 10 million traditional solar panels

Tesla CEO Elon Musk expects Tesla Energy to eventually grow to the size of Tesla Automotive. Musk believes energy storage will play a key role in that process. “In order to achieve a sustainable energy future, we have to have sustainable energy generation… so you need to have a lot of batteries to store [renewable] energy because the wind doesn’t always blow and the sun doesn’t always shine.” 

Tesla’s lithium-ion battery energy storage business has a new publicly traded competitor, Eos Energy Enterprises. Eos developed the Znyth® aqueous zinc battery to “overcome the limitations of conventional lithium-ion technology.” Eos promotes their Znyth® battery as a more sustainable, scalable, efficient, and safer energy storage alternative to lithium-ion batteries.

Solar Power’s Bright Future

Solar power converts sunlight into electricity. It is a clean energy alternative to fossil fuels, with a smaller environmental impact and carbon footprint. Solar panels are most effective in direct sunlight. However, they can still generate electricity in cloudy weather or cold temperatures. 

The sun is a promising energy source that can produce billions of years of electricity. On the contrary, fossil fuels are finite resources that could be used up within the next few centuries. The U.S. Energy Information Administration estimates the United States has enough dry natural gas to last about 92 years and enough recoverable coal reserves to last about 357 years.   

Greater investment in solar power can lead to greater national energy independence and less dependence on foreign fossil fuels. There are plenty of regions in the US, especially the Southwest, with sufficiently  high annual percentages of sunlight. 

Individual homeowners can attain a degree of energy self-reliance by buying into solar for its increasing efficiency and decreasing costs. Many solar array warranties cover about 25-30 years and arrays often last longer due to their durability. The median average photovoltaic degradation rate is a 0.5% loss of energy efficiency per year, so the solar panels on a roof could still be operating at 88% of their original capacity after a 25-year warranty. 

According to EnergySage, the typical solar panel payback period in the U.S. to break even on a solar energy investment is 8 years. After 20 years, a solar panel investment on your home or business can accrue savings ranging from $10,000 to $30,000. 

Solar’s Dark Side

Solar power is an intermittent energy source because the sun does not shine at all hours of the day. The intermittent nature of solar power makes it a non-dispatchable energy source. This means the electricity produced cannot be used at any given time to meet electricity demands. 

Electricity storage solutions address the intermittent nature of renewable energy like solar, wind, and wave power. MAC Solar Index believes solar-plus-storage will become even cheaper in coming years. Lithium-battery prices already dropped by 85% from 2010 to 2019. MAC predicts they will drop by another 52% by 2030.

Kauai Island Utility Cooperative solar plus storage plant
Kauai Island Utility Cooperative solar plus storage plant (PV Magazine)

Photovoltaic cells contain rare earth metals like cadmium, gallium, and indium. These metals are limited resources  their extraction for solar panels and other electronics must be carefully monitored in order to prevent total depletion.  

Solar modules are hard to recycle. Their components including plexiglass, metal framing, wires, glass sheets, and silicon solar cells must be separated in order to be recycled. This is a tedious process that requires advanced machinery. Complexity and cost increase the risk that a landfill becomes a solar panel’s final resting place. 

Improper disposal and breakage of solar panels can cause toxic chemicals like lead and cadmium to leach into the soil.  The International Renewable Energy Agency (IRENA) in 2016 estimated there was about 250,000 metric tonnes of solar panel waste in the world at the end of that year. 

IRENA projected solar waste could reach 78 million metric tonnes by 2050. Many experts are pushing for mandatory recycling of solar panels to curb future solar panel pollution. The cost of the recycling process currently exceeds the value of the materials that would be recovered. Policies that ban or incentivize solar recycling will be critical to the long term sustainability of solar operations. 

Soak Up the Benefits of Solar Power and Invest in Solar Energy

If you’re looking to invest in solar energy, TAN is the best pure solar ETF. To invest in solar and other clean energy companies, the ALPS Clean Energy ETF (ACES) suggested in our previous blog continues to be our favorite diversified renewable energy play.

For those wanting to invest closer to home, you can install solar panels on your own roof. Residential solar is a sustainable energy option that can increase the value of your home. In addition, solar panels pay for themselves after approximately 8 years of savings. Calculate how much you can save with solar here

How Does Community Solar Work?
Clearway Community Solar 

If you don’t want to install solar panels on your home, consider subscribing to a community solar project. Subscribers receive cost-reducing community solar credits on their electric bills for the renewable power produced. 

Trajectory Energy Partners and Clearway Energy is one such community solar project that offers Illinois residents with a ComEd or Ameren electric bill a 20-year community solar contract with no upfront investments. The program helps subscribers support local renewable power operations and save up to 50% on annual electricity supply costs. 

The future of solar energy is bright. Solar power is an indispensable element of the transition to a net-zero carbon emissions future. Solar energy’s marginal cost of production is zero we simply need to capture its rays. By letting solar PV soak up the sun, the more sparkling our environment will be for future generations.


To talk more about investing in solar, or other investment opportunities, contact us today. Together, we can find the right investments for you, the ones that align with your values and help you to reach your financial and life goals.

Go with the Flow — Investing in Hydropower

unnamed

What is Hydropower?

Hydropower is a type of renewable energy that uses the force of flowing water to produce electricity. Its energy comes from the water cycle: the continuous movement of water on, above, and below earth’s surface.

Hydropower is a renewable technology because it captures naturally occurring energy from the water cycle and produces electricity without reducing or using up water. The marginal cost of production for hydropower — and renewables like solar, wind, and geothermal energy — is zero.

Check out this 3-minute video on hydropower.

The most common type of hydropower production is an impoundment facility. Impoundment dams hold river water until its release through a turbine that activates a generator and produces electricity. The U.S. has over 90,000 dams, yet only 3% are active hydropower facilities. The majority of dams in the United States were built for irrigation or flood control purposes.

In 2019, conventional hydroelectricity’s generation capacity in the United States was 79,746 megawatts (MW) — or about 80 million kilowatts. This is enough electricity to fuel 32 million homes a year. The state of Washington produces the most energy from impoundment. It is home to the Grand Coulee Dam, the largest U.S. hydropower facility. The dam is also the largest U.S. power plant in generation capacity.

Dams are controversial because of potential harmful environmental impact. They destroy carbon sinks in wetlands and oceans, deprive ecosystems of nutrients, reduce biodiversity, cause habitat fragmentation, and displace poor communities. Fish ladders — a series of ascending pools that allow fish to circumvent a dam — are a solution to impoundment facilities that would otherwise hinder the migration of species like salmon up and down rivers.

Another type of hydroelectric power is diversion, also known as a run-of-river facility. This method diverts part of a stream through a canal or penstock. The water then spins a turbine and produces electricity before rejoining the main river. The typical capacity of a diversion facility is less than 30 MW.

Both small individual operators and large utilities own run-of -river facilities. In some cases, large utilities view these facilities as low value assets due to old equipment, inefficient operations and low power prices.

Pumped storage facilities store energy for later use by pumping water uphill when electricity is cheap to a reservoir at higher elevation. When there is high electricity demand, they release water to a lower reservoir and through a turbine to generate electricity.

Hydro operations can operate under federal, public, or private ownership. There can also be public-private and public-federal partnerships. Federal agencies operate about half of the total installed hydropower capacity in the U.S.

unnamed

Hydropower accounts for around 6.6% of the electricity generated in the United States. Hydropower was the nation’s largest source of renewable energy until wind power surpassed it in 2019. According to the U.S. Energy Information Administration, total annual electricity generation from utility-scale non-hydro renewable sources (wind, solar, biomass, etc.) has been greater than hydropower generation since 2014.

Total renewable energy resources represent 17% of U.S. electricity generation. Dirty coal still represents 23% of generation and is a major contributor to greenhouse gases. Renewable energy sources are poised to take coal’s market share aided by technological advances in energy storage.

unnamed

Advantages of Hydropower

Hydropower offers the lowest levelized cost of electricity across all major fossil fuel and renewable energy sources. Hydro is a reliable, cost-effective energy source due to low-maintenance equipment and longer facility lifespans that amortize significantly large upfront capital costs over time.

The total conversion efficiency of a hydropower plant ranges between 90-95%. Conversion efficiency is the useful energy output divided by the energy input. For hydro, it is the hydroelectricity output divided by the kinetic energy of flowing water input. Hydropower’s conversion efficiency is greater than the conversion efficiency of both wind and solar, with wind at a rate of about 45% and solar at 25%.

Hydropower has high diversification potential with other renewable energies. A portfolio with hydro, wind, and solar energy that is diversified across energy sources and regions can have a stabilizing effect on asset portfolios.

Hydroelectric facilities provide baseload power; they run continuously to meet the minimum level of power demand. This consistency makes hydropower complementary to intermittent renewables like wind and solar that can only generate electricity when the sun is shining or the wind is blowing. Hydropower depends on the more reliable flow of water to help meet baseline electricity demands while other renewables can supply peak demands.

Hydropower and Renewable Energy Storage

The push for decarbonization through renewables will require innovation in energy storage technologies that addresses the intermittencies of wind and solar energy. While pumped-storage hydropower accounts for 95% of U.S. utility-scale energy storage, lithium-ion battery storage has seen tremendous growth. The price of lithium-ion batteries has fallen by about 80% over the past five years, enabling the integration of storage into solar power systems.

NREL’s Renewable Electricity Futures Study estimated that if 80% of the United States’ electricity is powered by renewables by 2050, 120 gigawatts of storage would be needed across the nation. The U.S. currently has 22 gigawatts of storage from pumped hydropower and 1 gigawatt from batteries.

Another opportunity looming on the hydro horizon is the potential coupling of hydropower and Bitcoin mining. Bitcoin mining lacks an eco-friendly reputation as an energy-intensive process with a large carbon footprint. However, this can change if miners use electricity from renewable sources.

Much like energy storage utilizing lithium-ion batteries, Bitcoin and other cryptocurrencies are an energy storage technology. Converting energy into bitcoins and storing it for future purchases can help contribute to the storage needed for the renewable energy revolution.

Bitcoin miners can choose their location based on the cheapest cost of electricity. Cheap electricity happens to come from cleaner baseload energy sources like hydro, geothermal, and natural gas. If Bitcoin miners settle near renewable energy plants, they could reduce their emissions and soak up extra energy that would go to waste.

Go with the Flow — Investing in Hydro

Current trends show wind and solar energy assets are more frequently represented in institutional investors’ portfolios than hydropower assets. Hydropower facilities tend to have high upfront costs, complex installation processes, and absence from the market due to a history of public ownership and project sponsorship. These are some of the factors that create a scarcity of hydroelectric investment opportunities.

Brookfield Renewable (BEPC: NYSE) is one of the world’s largest investors in renewable energy. Its strong ESG practices support global decarbonization and create long-term value for stakeholders. In addition, it is geographically and technologically diversified.

There is 19,300 MW of renewable capacity located across North America, South America, Europe, India, and China. Hydro represents 7,900 MW (53% in U.S. & Canada), or 41% of capacity, followed by 4,700 MW of wind (52% in U.S. & Canada), 2,600 MW of solar, and 2,600 MW of energy storage and distribution assets.

Brookfield has an investment grade, BBB+ balance sheet. It has diverse, high-quality cash flows and a strong financial position. In effect, it can pursue growth opportunities and make distributions to shareholders. Brookfield targets annual equity deployment of $800 million in high-quality assets.

Their investment strategy involves acquisition and development of high-quality renewable power assets and businesses below intrinsic value. They also recycle capital from mature, de-risked assets, optimize cash flows through operating expertise to enhance value, and finance businesses on an investment grade basis.

Brookfield partners with governments and businesses to achieve their decarbonization goals. It has an 18,000 MW development pipeline diversified across multiple technologies and geographies, including approximately 2,400 MW under construction.

Since 2012, Brookfield EPC has grown its annual distribution by 6% compound annual growth rate. Brookfield expects to continue distribution growth by 5% to 9% annually. In addition, they deliver total returns of 12% to 15% to unitholders over the long-term.

Brookfield is the best way to go with the flow on the decarbonization megatrend and invest in the inevitable transition to renewable hydro, wind and solar energy.


To talk more about investing in hydropower, or other investment opportunities, contact us today. Together, we can find the right investments for you, the ones that align with your values and help you to reach your financial and life goals.

white-arrow