


The summer season has officially begun and following in the footsteps of the Griswold family, you’ve decided to take a typically American road trip. But instead of a final destination of Walley World, your destination is a more durable investment portfolio as you suspect the wheels may come off the US economy this summer. Fasten your seat belts, get out your road map, and drive along as we explore some of the key points of interest (POI) for the U.S. economy this summer.
First POI: National Debt Ceiling
One POI that could cause you to reduce your cruising speed this summer could be the National Debt Ceiling. The media and public have been in a veritable frenzy over the past month about the National Debt Ceiling as the legislative and executive branches of government have until June 5th to reach a compromise on raising the national debt limit. The U.S. Government reached its $31.4 trillion debt limit in January however the Treasury Department has been using “extraordinary measures” and accounting tricks to avoid a technical default. The U.S. Treasury Department recently warned that if the ceiling were not raised by June 5th, the U.S. Government could default on its payment obligations to debt holders.
About $6.8 trillion of this debt is owed to other federal agencies such as the Social Security Trust Fund, the Federal Old Age and Survivors Insurance and Federal Disability Insurance Trust Funds, and the Military Retirement Fund. The remainder is held by the public. Among these public debtholders are U.S. banks, investors, the Federal Reserve, state and local governments, mutual funds, pension funds, and several foreign governments. Almost half of U.S. debt is held in trusts for retirement, meaning if the U.S. government ever defaulted, it could have far-reaching impacts on current and future retirees. Much like you, these retired workers are likely looking to hit the road in their RVs this summer. Some sharp-eyed retirees may have foreseen this speed bump ahead and begun rethinking their travel plans. Many have pulled over into the relative safety and comfort of a rest area; tired and frustrated that their retirement income lies in the hands of politicians jockeying to ride shotgun beside the Commander in Chief.
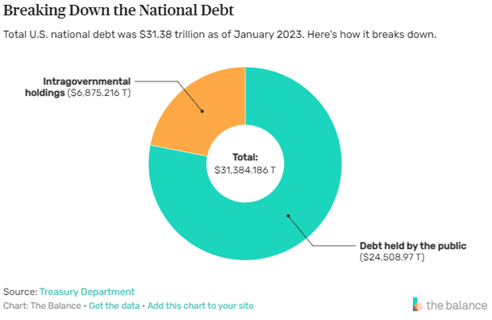
Source: The Balance Money
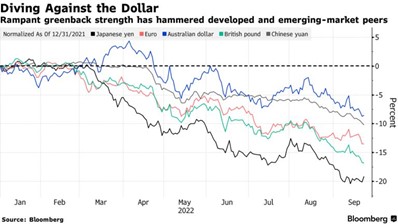
In addition to military leadership, the Commander in Chief holds primary responsibility for the conduct of U.S. foreign policy. Stiffing your foreign lenders would be a steering error with potentially fatal consequences. Japan, China, and the United Kingdom lead the line of geopolitical traffic cops, collectively holding over $2 trillion of U.S. debt. Japan and China’s large holdings of U.S. debt help support the value of the dollar as the global reserve currency and finance U.S. purchases of their relatively cheaper goods. The U.S. economy is one of the key global economies as most foreign countries have some trading relationship with the United States. In addition, the U.S. dollar dominates global exchange markets, representing 90% of trading volume. A U.S. default on its national debt would cause a major economic pileup and delays in global economic activity transmitted through the U.S. dollar-based global financial system. The U.S. maintained its AAA or equivalent credit rating by the major reporting agencies until the last debt ceiling crisis in 2013, when Standard and Poors downgraded the U.S. to an AA+ credit rating, citing political brinkmanship over raising the Federal debt ceiling.
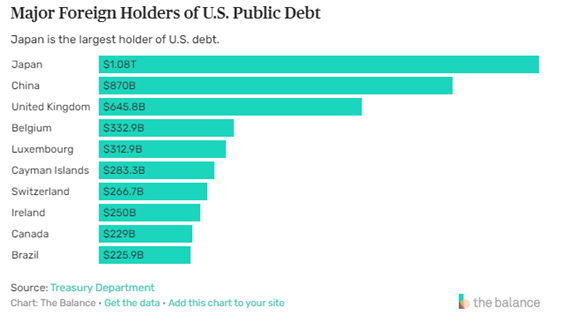
Source: The Balance Money
Thankfully, legislators have reached a proposed deal that would lift the federal debt limit; however, the proposed legislation will do little to reduce the government spending that sped up during the COVID-19 pandemic. The package would suspend the borrowing limit until January 2025 along with limiting military spending growth to 3% and imposing limits on nonmilitary spending. Some other features of the deal include some cutting of funding for the Internal Revenue Service and a tightening of work requirements for the Supplemental Nutrition Assistance Program. The deal still needs to be approved by both the House and Senate before going to the Commander in Chief for his signature. At this juncture, it seems likely that these two backseat drivers will reach agreement soon enough to apply the brakes and avoid a catastrophic Thelma & Louis ending.
Second POI: Revisiting Cryptocurrencies
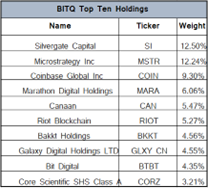
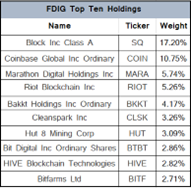
Next stop on our summer road trip, is a place we have visited before, cryptocurrencies. At the end of 2022, we discussed some of our key investment themes for 2023 with crypto assets making the list. Cryptocurrencies, such as Bitcoin and Ethereum, were on everyone’s POI list last summer. However, the epic failure and fraud of one of the largest digital currency exchanges, FTX, halted many people’s crypto ride prematurely. The price of Bitcoin fell 65% last year but has it started to make a comeback? The short answer is yes however it has not yet reached its all-time high of 2020. Bitcoin is up 67% year to date with Ethereum following suit, rising almost 59% year to date. While crypto assets are increasing in popularity again after their self-inflicted pileup last year, many remain skeptical about whether alternative currencies are the safest route on the investment highway. Similar to old Route 66 that runs from Chicago, Illinois to Santa Monica, California, digital currencies have had several bumps, potholes, and dead ends across its history. Still, Route 66 remains a viable, albeit alternative pathway. It has not been abandoned by more adventuresome travelers. Inflationary pressures and a long history of fiat-based monetary accidents have venturous investors exploring these digital assets for diversification benefits as uncertainty looms around the U.S. economy and recession odds grow with the length of days. We expect to see more sensible government regulation in this space over time. The stakes have been raised with SEC cracking down on the popular trading and exchange platform, Coinbase, in April. Congressional leaders from both sides of the aisle have been working on providing legislative clarity where the SEC has left a regulatory vacuum. Cryptocurrencies may not be on everyone’s destination list this summer; however, we will be keeping a watchful eye on their route this summer. The incessant drumbeat of global de-dollarization and circumventions of U.S. hegemony by U.S. allies and foes alike will be good fodder for economists’ ghoulish tales around summer campfires.
Third Stop: Energy Prices
From the air conditioning in your home to the gas tank filled up for that summer road trip, energy prices remain a stipulation in summer travel plans. Last year, energy prices, impeded many people’s ability to take that summer vacation or forced them to turn down the thermostats in their homes as the Russian-Ukrainian conflict put price pressure on oil and natural gas. Europe felt the brunt of spiking energy prices as its largest supplier of natural gas, Russia, shut off its pipes to countries supporting Ukraine in its war efforts. As a result, prices skyrocketed which sent shockwaves to energy consumers around the world. Thankfully, Europe pushed its populous to conserve energy, and, coupled with a mild Winter, the European Union was able to escape a possible pileup widely predicted this past winter. Energy prices have largely stabilized along with the apparent stalemate in the Russia-Ukraine War with oil prices falling 7% and natural gas prices falling 42% since January 1st making your summer travel a bit cheaper going into the warmer months.
Fourth POI: Hospitality Industry
Our final stop is a look at the hospitality industry: the epicenter of summer travel season. The hospitality industry which includes hotels, bars, and restaurants took a major hit during the pandemic as restrictions and public fear kept many people locked down. However, the CDC recently lifted its Public Health Emergency as COVID-19 has become less virulent and more manageable from a public health perspective. This news couldn’t have been better timed for the hospitality industry as this summer is projected to be full of travel for Americans. A study conducted by Deloitte found that 50% of Americans plan to take trips this summer that include hotel or rental home stays along with many reporting they will be traveling internationally this year. As a result, bars, hotels, and restaurants are among the economy’s fastest-growing employers according to the Wall Street Journal. This hiring frenzy comes on the heels of increased consumer spending in April even though recessionary fears persist. Overall, much like this author, Americans seem to be making room in their budgets for that epic 2023 summer road trip making the hospitality industry one sector to watch this year.
“When all else fails, take a vacation.” – Betty Williams
Hopefully, we’ve whetted your appetite for a summer road trip. Let’s face it, our elected officials and central bankers are driving erratically and should get off the road. Thankfully they’ll be on summer break soon, probably just as soon as they raise the debt ceiling.
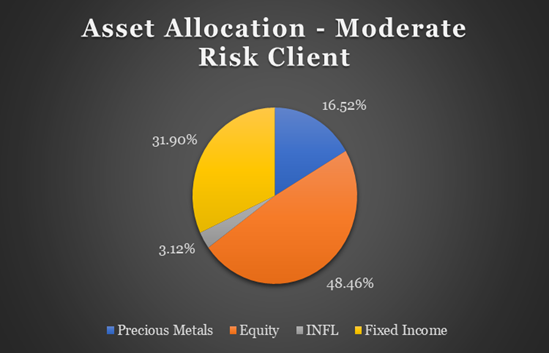
There is an old Wall Street adage, “Sell in May and go away” that ties in well with this summer road trip theme. Of note, we’ve tactically reduced Servant Financial model portfolios to the lower end of their risk tolerance range earlier this month to keep your summer road trip on track and carefree. Although we cannot prevent government or Fed-induced market accidents from occurring, we can limit the portfolio damage. With the S&P 500 trading at 4,200 and a rich 24 times last twelve-month price-earnings ratio (PE) and 19 times forward PE, selling in May and focusing on your summer vacation seems like a very sensible thing to do.
Contact us today to learn how you can keep your investment portfolios safely on the road this Summer.

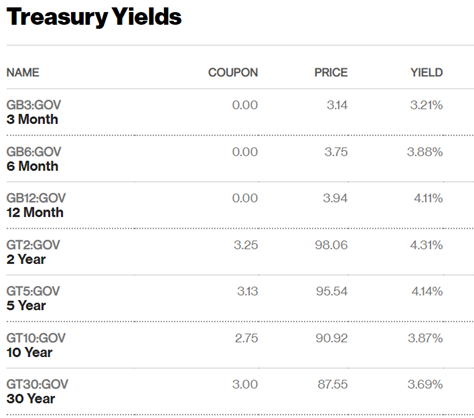
 Clear signs of an impending Fed policy mistake would lead us to aggressively consider a tactical allocation to commodities through PDBC. One low-probability scenario would be a significant dislocation or lack of market liquidity in the U.S. Treasury market that forces the Fed to purchase treasuries. The Fed would effectively be adopting yield curve controls, much like the recent
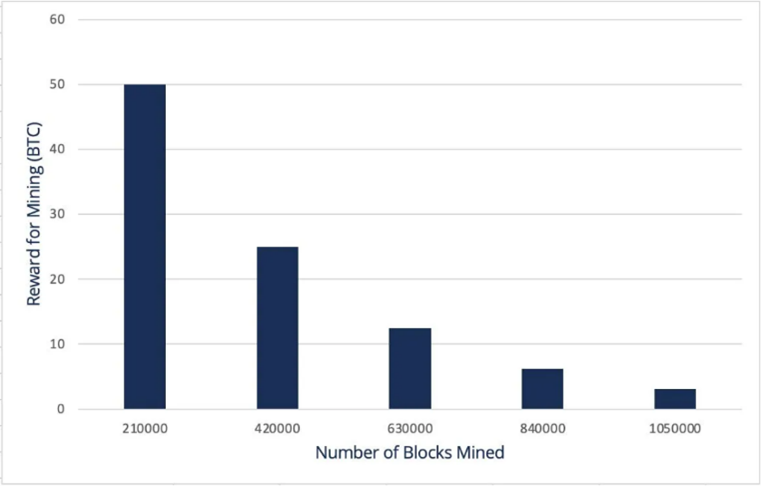 About every four years or 210,000 blocks verified, the Bitcoin reward for solving a block is halved. This rate was established at inception to limit the supply growth and cap the total number of Bitcoins that will ever exist at
 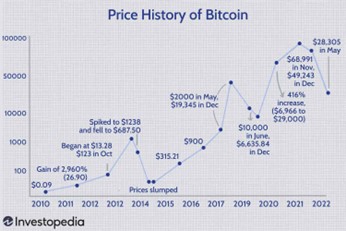 Fourteen years later, it is hard to imagine Satoshi had any idea that his creation would become such a big deal with some countries even using