Email us at info@servantfinancial.com to talk to a financial advisor today!

Email us at info@servantfinancial.com

Mind the Gap In U.S. Infrastructure Investment

In its 2021 report card “Failure to Act: Economic Impacts of Status Quo Investment Across Infrastructure Systems”, the American Society of Civil Engineers (ASCE) gave the United State’s infrastructure a “C-,” up from a “D+” in 2017—the highest grade in twenty years. Still, ASCE estimated an “infrastructure investment gap” of nearly $2.6 trillion this decade that, if unaddressed, could cost the United States $10 trillion in lost gross domestic product (GDP), 3 million jobs, and $2.3 trillion in exports by 2039.

The chart below summarizes ASCE estimated spending gaps to be mindful of in the 2021 infrastructure report card:

By far the largest spending gap in nominal dollars at $1.2 trillion is in surface transportation which includes highways (ASCE – D grade), bridges (ASCE – C grade), and other transit systems (ASCE – D- grade).   These vulnerabilities in U.S. infrastructure were punctuated recently by the mishap at the port of Baltimore.

Baltimore Bridge Collapse

While the nursery rhyme whimsically suggests that the London Bridge may be crafted of silver and gold, recent events have starkly toppled this notion. On March 26th, 2024, tragedy struck as a cargo ship departing from the Port of Baltimore en route to Sri Lanka experienced engine failure. This untimely malfunction while the ship was leaving the port led to a collision with the Francis Key Scott Bridge, one of America’s busiest roadway bridges. Prompt action by transportation authorities upon receipt of the ship’s “mayday” call enabled them to halt traffic just in time, yet the collapse claimed the lives of six construction workers performing repair and maintenance work on the bridge. The news of this disaster shocked the nation, sparking concerns about potential disruptions to U.S. supply chains and highlighting ASCE’s earlier warnings about underinvestment in the country’s strategic infrastructure. Cleanup of the bridge wreckage is ongoing with the U.S. Army Corps of Engineers anticipating the port’s reopening by the end of May.

The Port of Baltimore ranks as the 15th largest container port in the United States with its major exports including automobiles, coal, natural gas, and agricultural equipment. India is the largest trading partner with the Port of Baltimore with coal being the primary product being exported to India. Even though the port is expected to re-open by the end of May, the bridge collapse has caused an estimated $28 billion worth of goods to be diverted to other ports leading to additional transportation and fuel costs and delays for suppliers. However, analysts do not expect there to be a considerable impact on consumer prices globally. Locally, the bridge collapse has negatively impacted 15,300 port jobs and is estimated to have cost the State of Mayland $28 million in potential lost tax revenue.

Analysis of U.S. Infrastructure

The Baltimore Bridge collapse is unlikely to have a meaningful impact on global markets, however, this incident warrants more diligent oversight of the U.S. Port system given its importance to U.S. international export markets. The U.S. exports 2.3 billion tons of freight from its seaports annually and currently has 208 commercial ports across America’s coastlines. The largest U.S. port is located in Houston, Texas with more than 265 million tons of freight flowing from the port annually. U.S. ports handle 43% of all U.S. international exports totaling almost $2.3 trillion worth of goods making them crucial to the U.S. Economy. Keeping these ports running smoothly is crucial to the United States’ $27.4 trillion economy as highlighted by the 2021 ASCE infrastructure report.

Experts suggest that the independent ASCE report contributed in part to the bi-partisan infrastructure bill passed in March of 2022 called the Infrastructure Investment and Jobs Act (“Infrastructure Act”).  The Infrastructure Act provides $550 billion from 2022 to 2026 to improve roads, bridges, mass transportation systems, and water infrastructure. The main goal of the legislation was to improve supply chain resiliency through improved security, inventory management, and emergency stockpiles after the disruptions that occurred during the COVID-19 pandemic.

Gaps for Investment

The 2021 ASCE report card and recent events make it clear that one of America’s investment priorities should be its strategic transportation, telecommunication, and energy infrastructure. During the spring and summer seasons, it is nearly impossible to travel on of the 164,000 miles of the United States interstate highway system and not encounter road construction or bridge repairs. From an investing perspective, investing in local and national infrastructure, whether it’s transportation, telecommunications, energy, medical, or water management systems, has never been more critical. According to Marsh McLennan, infrastructure emerged as an investment class in the mid-1990s as the .com revolution revealed opportunities in the telecommunications and internet industries. Currently, $100 billion of capital is raised annually for infrastructure expenditures through a variety of investment vehicles, with the most common being private equity and real estate funds. More recently, other forms of tax-advantaged opportunities for infrastructure investing have emerged. Under the 2017 Tax Cuts and Jobs Act, the federal government introduced the opportunity zone program.   Opportunity Zones (OZs) are economically distressed communities, designated by the IRS, in which investments in real assets and infrastructure, with requisite improvements thereto, may be eligible for tax-exempt appreciation and other tax benefits. Opportunity zone investments support local economies by building workforce housing, medical or industrial facilities, or renewable energy, data, telecommunication, or agricultural infrastructure. If you are interested in learning more about farmland OZ infrastructure investment in rural America, we encourage you to visit the website for Promised Land Opportunity Zone Fund.

Artificial Intelligence Infrastructure

One of the more topical areas within infrastructure investing these days is in the semiconductor space to meet the growing demand for microchips used in artificial intelligence (AI). AI has been around for several years but recent deployments and advancements of Chat GPT and other AI software are poised to potentially revolutionize the way many businesses are run. The United States has traditionally been dependent on China for microchips and the supply chain backlogs from the COVID-19 pandemic highlighted the risk of continued dependence on Chinese production for this crucial integrated operating component in everything from cars to agricultural equipment. As a result, the White House recently announced a $5 billion investment through the CHIPS and Science Act which will be used for research and development in the semiconductor industry. The goal is to boost domestic chip manufacturing while bolstering a qualified workforce to ensure strategic production capacity remains in the U.S.

The other consideration with artificial intelligence is the immense amount of electrical power necessary to fuel the massive AI computational capacity of the future. As our country works to create a more carbon-neutral society, AI companies are publicly promoting and sponsoring investments in nuclear power as a reliable, renewable baseload power source. Alex De Vries from the Vrije Universiteit Amsterdam School of Business and Economics researched the necessary electric power for the expected AI infrastructure buildout and estimatedthat a 50% increase in the amount of electricity would be required to power the growing demand for AI-driven data collection and analysis.  Alex’s analysis bodes well for all renewable and traditional sources of electrical generation generally.   Further, many experts believe AI-driven demand for electricity may result in a nuclear power renaissance.

Servant Financial expanded its allocation to real assets and infrastructure by adding the Sprott Uranium Miners ETF (Ticker: URNM) and Recurrent MLP & Infrastructure Class I mutual fund (RMLPX) to client portfolios in mid-February.  Each fund received an initial position size ranging from 0.7% to 1.7% depending on investor risk profiles.   URNM invests in uranium mines and the infrastructure necessary to procure and process uranium. The ETF invests in 20-40 globally diversified stocks with its top holdings consisting of Cameco which is a Uranium producer located in Saskatoon, Canada. URNM’s total return year-to-date through April 26, 2024, was 5.7%.

RMLPX invests in energy infrastructure master limited partnerships (MLPs) and C‐corporations, which primarily hold midstream pipeline assets. RMLPX’s total return year-to-date through April 26, 2024, was 17.0% and its current yield is 5.7%.  Servant Financial will continue to closely monitor URNM’s and RMPLX’s performance along with its other real asset allocation as the economy moves through a transitionary period that has the potential to reignite inflation.  The nascent nuclear renaissance to support the artificial intelligence capacity buildout will also be a keen area of interest.

The recent Baltimore Bridge collapse serves as a blunt reminder of the vulnerabilities within our transportation networks and the potential ripple effects on domestic supply chains. As we continue to assess its aftermath, it is clear from the ASCE 2021 report card that investments in infrastructure are not just prudent but imperative for sustaining economic growth and prosperity for communities nationwide. Fortunately, investment opportunities abound, spanning from traditional sectors like transportation and energy to emerging fields such as data centers and artificial intelligence infrastructure. Whether it’s investing in local roads and bridges or speeding along the information superhighway of the future with artificial intelligence, infrastructure investing is poised to remain a cornerstone in investment portfolios for years to come.

While bridges aren’t made of silver and gold, silver and gold are common materials used in computer chip design, including artificial intelligence chips. Gold is often used for its excellent conductivity and resistance to corrosion, while silver is valued for its high thermal and electrical conductivity. Both metals play crucial roles in ensuring the efficiency and reliability of computer chips used in AI applications.  By minding the gap in U.S. infrastructure investment, your investment portfolios may shine brighter.

Got Questions?

In the December 2022 newsletter, we featured “12 Investment Themes of Christmas” where we presented important forward-looking finance considerations for the approaching new year. We discussed economic themes surrounding interest rate trends, inflation, recession predictions, consumer spending, cryptocurrencies, and farmland among other topics. We thought a review of 2023 in the form of queries would be a good springboard for our themes for 2024 – a few questions before the quest for answers if you will.

 1. Are Fed Hikes Finished?

In a bold move to address decades-high inflation, the Federal Reserve added 1% to its benchmark federal funds rate by way of four 0.25% hikes, bringing its target rate to a new range of 5.25% to 5.5%.  However, the Fed has held its target rate steady since its last hike in July. These four increases follow a series of seven interest rate hikes in 2022 with the target rate ending 2022 at 4.25% to 4.5% up from 0.0% to 0.25% in March 2022.

The Fed appears to be done and will await the lagged effect of its aggressive hiking campaign.  It is commonly believed that monetary policy works with “long and variable lags” (Milton Friedman dictum) of up to 18 months after a rate increase.  Fed Chair Powell has made it clear that the Fed will retain rates at current high levels for an indeterminate period. Powell also left open the possibility of more rate hikes after the Fed’s mid-November meeting. The Fed will render its next interest rate decision in mid-December with the bond market expecting the Fed to remain on hold at this meeting.

The Fed’s commitment to addressing the challenges posed by inflation has been digested by the bond market with the market consensus of a first-rate cut pushed out until June 2024.  This is consistent with the Fed Reserve Board’s most recent dot plot for a median Fed Funds Rate of 5.1% for 2024.  But can we be certain that Fed hikes are finished?

2. Has Inflation Been Tamed?

The Fed’s aggressive interest rate hikes appear to be having a positive impact. Recent data reveals a notable drop in the inflation rate with the October 2023 headline Consumer Price Index (CPI) showing a 3.3% drop year over year. The headline CPI for 2023 currently sits at 3.2% with core CPI (less volatile food and energy) at 4.0%. This marks a significant improvement compared to the 6.5% headline inflation rate in 2022 but remains well above the Fed’s 2% inflation target. The slowing inflationary trend is great news for consumers and businesses. Lower inflation rates mean that the prices of goods and services are increasing at a slower pace, allowing consumers to make their hard-earned money go further.

While there are still challenges in the housing market with rising costs and slowing sales, the overall outlook suggests an optimistic shift toward lower inflation and eventually more affordable housing costs.  If the Fed has achieved its goal of a soft economic landing with CPI heading towards its 2% inflation target, then homebuyers can expect lower mortgage payments as the Fed interest rate cuts begin.  The Fed Reserve Board’s most recent dot plot for median headline PCE inflation (Personal Consumption Expenditures Price Index, the Fed’s preferred inflation measure) was forecasted at 2.5% and Core PCE of 2.6% for 2024.  But can we reasonably expect that inflation has been tamed by the Fed absent some sort of economic fallout?

3. Is A Recession Inevitable? 

Despite earlier concerns about a possible 2023 recession, the economic landscape has shown incredible signs of resilience and improvement despite the Fed’s rapid hiking campaign. Economic indicators such as unemployment rates and GDP growth are fundamental measures of a country’s economic health. The unemployment rate, which stood at 3.7% in 2022, has increased only slightly to 3.9% in 2023. This trend of modest softening of employment is consistent with the Fed Reserve board’s most recent dot plot for a median unemployment rate of 4.1% for 2024.  Fortunately, the GDP growth rate on the other hand has surged from 2.1% annual run rate to 4.9% in the third quarter of 2023. This strong GDP growth suggests an economy more resilient than Fed expectations with increased job opportunities and improved consumer spending.

The Fed Reserve Board’s most recent dot plot calls for median 2023 GDP growth of 2.1% and GDP growth slowing to 1.5% for 2024.

Amazingly, the Fed dot plots for interest rate policy, inflation, employment, and GDP growth are all telling a synchronous tale of a Goldilocks economy – warm enough with steady economic growth to prevent a recession; however, growth is not so hot as to cause inflationary pressures and force additional Fed rate hikes.  Is it possible the Fed porridge gets too cold, and a recession is inevitable or too hot and the Fed has to institute further rate hikes to cool its stew?

4. Is the U.S. Dollar Set To Rise?

The US Dollar Index has held relatively steady since the end of 2022 and currently sits at 104.20. Despite a small dip to 100 in July, the dollar continues to reflect the strength, resilience, and reliability of the U.S. economy. The U.S. economy’s resilient performance, coupled with the US Dollar Index holding its ground, underscores the Dollar’s status as a safe-haven asset. This is particularly notable in the global context where other major economies like China, Japan, UK and Europe are grappling with more pressing economic challenges such as recessionary conditions (China, Europe) and persistent inflation (Japan, UK).  When a formerly synchronous global economy moves into economic and geopolitical disharmony, does the world’s reserve currency rise in value.

Source: MarketWatch

5. Will Consumers Keep Spending?

According to the latest data, consumer spending growth has risen 4.9% in 2023 following a 9% increase in 2022. This is likely attributed to rising wages and the largesse of COVID-era government spending programs. As these government programs are phased out, particularly the moratorium on student loan debt repayments, more and more people are taking on unnecessary debts and overspending, especially with very high interest rate credit cards. People are making luxury purchases, spending money on traveling, purchasing new cars and clothes, etc. In September of 2023, the total amount of U.S. credit card debt broke $1 trillion for the first time in history. This immense growth in consumer debt raises alarms about financial stability on both individual and systemic levels. More and more consumers will potentially face immense financial strain if the employment picture softens considerably or if illness impacts a household breadwinner. With Black Friday and Cyber Monday here, we’re about to see firsthand whether consumers will keep spending.

6. Perpetual Labor Shortages?

The labor shortage challenges identified last year persist into the current economic landscape. Industries across the board are struggling to find enough skilled workers to meet their business demands. This mismatch between demand and supply can stall economic growth, decrease productivity, and delay production and services. The worker shortage persists in all industries except for goods manufacturing, retail, construction, and transportation. There are currently 9.6 million job openings in the U.S. with only 6.1 million unemployed persons. Even if every unemployed person were to become employed, there would still be an insufficient workforce to meet the demands of employers. This is especially true for the financial services industry where only 42% of the existing job vacancies would be filled if all experienced and qualified professionals (in finance) joined the workforce. The shortage remains a critical problem for many industries and finding an effective solution is proving to be extremely challenging. Have we entered an era of perpetual labor shortages? If so, what does the mean for the inflation picture?

7. Is the Russian-Ukrainian War Really Ending?

The two-year old conflict between Russia and Ukraine, currently deemed a stalemate, has prompted the U.S. and its allies to signal the necessity of negotiating a peace deal. The prolonged nature of the conflict has decimated Ukraine’s national resources, particularly its military personnel, with reports indicating a disastrous shortage of soldiers. The U.S. Department of Defense’s (DOD) recent announcement on November 3, 2023, reveals an increased commitment to supporting Ukraine with equipment, but who will operate them? The DOD is supplying Ukraine with additional military vehicles and gear, $125 million for immediate battlefield needs, and $300 million through the Ukraine Security Assistance Initiative (USAI) to enhance Ukraine’s air defenses. This brings the total U.S. financial support for Ukraine to a staggering $44.8 billion which highlights a sustained and costly effort to support Ukraine’s defense against Russian aggression.

Sadly, new evidence is emerging that a peace deal was achievable at the beginning of the war. At a recent meeting with the African delegation, Putin showed the draft of an outline of a preliminary agreement signed by the Ukrainian delegation at Istanbul in April 2022. The peace deal provided for Russia to pull back to pre-war lines if Ukraine would agree not to join NATO (but Ukraine could receive security guarantees from the West).

Recently, there have been notable shifts in the pricing of key natural resources, such as softening in oil, gas, and agricultural commodities. This signals a potential easing of tensions and the removal of the market risk premium as the end of the war may be in sight.  But if the same foolhardy political leadership prevails that rejected the potential peace deal in the early stages of Russia’s “police action” in Ukraine, how can we be fully confident the Russia-Ukraine war is really ending?

8. Will Energy Disinflation Continue?

Surprisingly, natural gas prices for home utilities have decreased by 20.8% since 2022. Gasoline prices at the pump have also declined with the average price per gallon dropping to $3.41 from $3.95 in December 2022. Gas prices are primarily dropping due to lower demand from drivers (less overall driving) and cheaper blends of gas (lower production costs mean lower costs at the pump).  In the context of the U.S. economy, declining gas prices may signal a period of lower economic activity or a slowdown. Gas prices are expected to drop even more throughout the winter and into 2024 ahead of the summer driving season. This disinflationary pulse in consumer energy prices signifies ongoing adjustments in the supply-demand equilibrium and could have broader implications for consumers’ standards of living.  A key question for consumers in 2024 is will this energy disinflationary trend continue and offset inflation pressures on household budgets elsewhere.

9. Are Bitcoin and Other Blockchain-based Businesses Institutionally Investable?

On November 2, 2023, FTX founder Sam Bankman-Fried, once a billionaire and a prominent figure in the worlds of crypto and politics, was convicted of one of the largest financial frauds in history. A Manhattan federal court jury found him guilty on all seven counts affirming that he had stolen $8 billion from users of his now-bankrupt cryptocurrency exchange. This verdict comes almost a year after FTX filed for bankruptcy which wiped out Bankman-Fried’s $26 billion net worth. This conviction is a substantial win for the U.S. Justice Department with Bankman-Fried facing a potential maximum sentence of 110 years.

With the start of the FTX case, the price of all cryptocurrencies experienced a significant downturn due to shaken confidence in the crypto market and its many charismatic, entrepreneurial founders. However, proven, transparent blockchain-based business models are starting to rebound with Bitcoin emerging as a top-performing asset class for 2023.   Year-to-date through November 17, 2023, bitcoin had gained 67% compared to gains of 26% for midstream energy (Alerian MLP Index), the second-best asset class, and 19% for the S&P 500, third-best asset class.

U.S. regulators at the Securities and Exchange Commission (SEC) have awoken from their slumber and are now taking a more proactive regulatory stance.  After seemingly being asleep at the wheel, the SEC has been taking highly visible actions against bad actors like Sam Bankman-Fried and the CEO and founder of Binance, Changpeng Zhao. Zhao has recently stepped down from Binance after pleading guilty to violating U.S. anti-money-laundering legislation. He faces a $50 million fine and a potential prison term. In addition, Binance has agreed to pay a $4.3 billion settlement. Bankman-Fried and Zhao’s cases are part of a broader crackdown on crypto-related financial crimes and display the increased regulatory enforcement actions in the digital asset industry.

Proactive regulation and legislative clarity are welcomed by many of the leading crypto players like Coinbase, the largest U.S. cryptocurrency exchange platform, and Grayscale Investments, the world’s largest crypto asset manage based on assets under management and the sponsor of Grayscale Bitcoin Trust (GBTC).  The expectation of increased legislative and regulatory clarity from Congress, the SEC, and the Commodities Futures Trading Commission (CFTC) in the near future has encouraged several brand-name, highly credible institutions, like BlackRock and Fidelity, to step into the digital asset space.  The CFTC has determined that bitcoin is a commodity and the SEC and IRS have not publicly challenged that determination. We believe that legislative and regulatory actions in 2024 may emphatically answer the question, “Are bitcoin and other blockchain-base businesses institutionally investable?”

10. Will Student Loans Be Forgiven?

After the U.S. Supreme Court in June struck down his unilateral attempt to “forgive” at least $400 billion in student loans, President Biden has diligently sought  a work-around to this reprimand from the highest court in the land. In October 2023, roughly 3.6 million Americans received a nice Christmas present from President Biden with potentially $127 billion of their student loan debt being forgiven. President Biden announced the plan earlier this year which brought joy and relief for some students and criticism and scrutiny from many other students and taxpayers(some of whom had already paid off their student loan debts). By alleviating a substantial portion of student debt, the plan aims to ease the financial burden on millions of Americans, providing them with increased financial flexibility and potentially curry their favor in the 2024 Presidential election. Based on annual income, students may qualify for student loan relief of up to $20,000.


The move has sparked considerable debate, drawing attention to questions of fiscal responsibility and the long-term impact on the country’s financial health and inflation rates. This also begs the question of where the money for this forgiveness will come from as the US government already faces $33.7 trillion of debt. The current iteration of student loan forgiveness rests on the Biden Education Department’s claims it has the authority to expand income-driven repayment under the Higher Education Act.  This directive is subject to Congressional legislative oversight and/or Supreme Court challenge and begs the question, “Will Students Loans Be Forgiven?”

11. Will Farmland Continue To Be the Star Of the Show?

Farmland stole the mic the last few years as an emerging institutional asset class. Its low volatility and historical negative correlation with traditional assets and positive correlation with inflation had investors lining up to find their slice of farmland heaven. As a result of the increased interest, strong commodity prices, and global food demand, the value of farmland rose throughout the United States 15-25% in just a two-year period from 2020 to 2022. However, that growth had some wondering if it would continue through 2023. In August 2023 the USDA reported farmland valued appreciated 8.1% from 2022 to 2023 but we are starting to see some signs that transactions may slow in the new year. Growing input prices made planting commodities more expensive while commodity prices have declined from peaks in 2021 and 2022. While net farm income is projected to back off from a peak in 2022, it is still projected to remain modestly above the 20-year averages for net farm income and net cash farm income. Even if U.S. farmland leaves the podium as one of the top performing asset classes in 2024, it will always have a seat at the table because of U.S. agriculture’s vital role in making sure the 8.1 billion mouths across the world are fed.

12. How Should a Diversified Portfolio Change?

At Servant Financial, our role is to help you plot the course in these uncertain times. We understand that recent inflationary trends, costly patterns of increased geopolitical conflict, and increased economic and market volatility may cause investor unease.   The basic investment principle of portfolio diversification has more often than not proven its character in the past and we expect it will continue to do so in the future.  That’s why we are asking the questions now on behalf of our clients so we can continuously assess the risk-reward opportunity set now available.  Last month’s featured article, “Got Gold?” established our foundational thinking that the traditional 60/40 (equities and bonds) portfolio allocation will struggle in an era characterized by economic uncertainties, inflation, and geopolitical unrest.  Our task in the ensuing weeks and months is to live these foregoing twelve questions towards some range of likely outcomes and a capstone result that answers the question, “how should a diversified portfolio change?”


Got Gold?

Hedge fund investor and billionaire Ray Dalio of Bridgewater Associates once retorted “If you don’t own gold, you know neither history nor economics.” Gold interest began spiking again during the COVID-19 pandemic as investors flocked to real assets to hold their money in while equities were flopping. As the S&P 500, NASDAQ, and Dow Jones have started on a downward trend once again, gold has again been experiencing gains in value. Hopefully, most readers can answer yes when asked “Got Gold?”  Servant Financial clients can assuredly answer affirmatively as outlined at the close of this article.

Despite Dalio’s admonition, gold holders, or gold bugs as they are affectionally called, are in the minority of U.S. investors. The Gold IRA Guide conducted a survey in 2020 to reveal the opinions of Americans surrounding gold and silver ownership. 1,500 Americans were surveyed between the ages of 18 and 65+. The survey revealed that 89% answered “no” when asked “Got Gold?”  Only 10.8% of respondents owned either just gold (4.3%) or both gold and silver (6.5%). Some respondents just owned silver (5.1%), suggesting a combined 84% of Americans owned neither gold nor silver at that time.

An updated survey by Gold IRA Guide in May 2022 of 2,500 American households found that almost 4 out of 5 reported having done nothing with their investment portfolio or retirement accounts to hedge against generationally high inflation.  Consumer Price Inflation (CPI) was reported above 8% for all items in both March and April of 2022.  Frankly, I think this is a sad commentary on institutional money management because it is very likely that many of these survey respondents were working with trusted investment advisors.  Unfortunately, a large majority of money management firms have apparently not “studied history or economics.”  Lemming-like, many institutional money managers are beholden to the traditional 60/40 stock and bond regime that has worked so well for the last 3 decades since the start of the 1990s.

Ray Dalio has also stated that “There are two main drivers of asset class returns – inflation and growth.”  We know from history that growth has been the dominant driver since the 1990s aided by a secular decline in inflation and interest rates.  Unfortunately, over the next 30-plus years, our elected geniuses in Washington and their co-conspirators at the Federal Reserve mistook that secular trend for permanence and repeatedly doubled down on the mantra “deficits don’t matter.” While most American households cannot feasibly operate under a budget deficit, the U.S. government seems to think they can. Washington elites ignored “history and economics” by spending and printing without limitation.  It’s as if they were seeing the world through Morgan Wallen Whiskey Glasses:

Line ’em up, line ’em up, line ’em up, line ’em up

Knock ’em back, knock ’em back, knock ’em back, knock ’em back

Fill ’em up, fill ’em up, fill ’em up, fill ’em up

‘Cause (INFLATION) ain’t ever coming back.

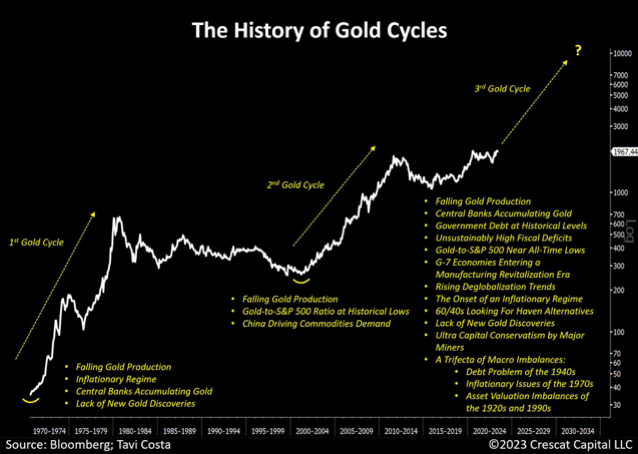
However, it is now increasingly apparent that we are entering a secular period in history where inflation trumps growth as the primary driver of asset class returns.  Safe passage through this new secular inflationary period requires polishing up on the history of gold cycles.  The chart below from Octavio Costa at Crescat Capital provides a nice overview of gold’s price history since the 1970s.  It’s important to note on this timeline that in August 1971 President Nixon closed the “gold window” which prevented foreign governments from redeeming their dollars for gold.  Up until this point, gold had served as an important governor on U.S. spending and printing.

History shows that when gold was the primary monetary unit before the adoption of gold-backed fiat currencies, gold also served as a governor of war.  Would-be aggressors were limited in financing war against their neighbors by the amount of gold stored in their treasuries and the amount of gold booty or other resources they could recover from their conquests. The same goes for pirates and naval conquests.

For those readers interested in digging a little deeper into gold, we’ve found that the most comprehensive analysis of gold markets available is entitled “In Gold We Trust”, prepared annually by Incrementum.  Incrementum published their 417-page, 17th edition earlier in 2023 entitled Showdown | In Gold We Trust report 2023 (hyperlinked to YouTube summary presentation of the report).

Incrementum presciently entitled their May 2023 edition “Showdown.”  The report summarizes the four important Showdowns that they expected to play out over the next year or more:

  1. West Versus East Geopolitics
  2. Competing Currencies (BRIC+ Currency Bloc)
  3. Failing Monetary Policies
  4. Price of Gold (gold price advances have been tame relative to Incrementum’s cycle view)

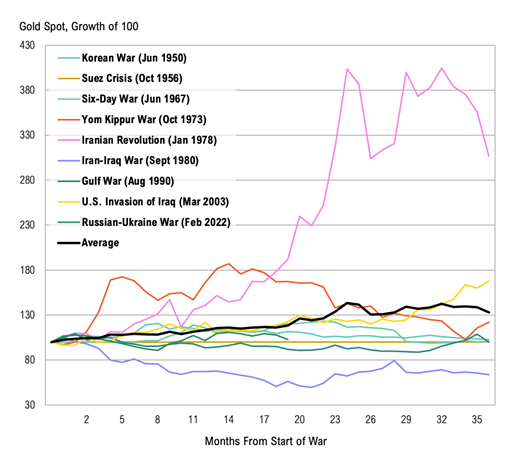
Obviously, Incrementum was aware of the Russia-Ukraine “showdown” at the time of publication but likely could not have anticipated another violent “showdown” in the Middle East.  Sadly, the inhumanity of humanity intervened again in recorded history with another Middle Eastern war on the 50th anniversary of the Yom Kippur War of 1973 (also known as the Fourth Arab–Israeli War).  That war began on 6 October 1973, when an Arab coalition led by Egypt and Syria jointly launched a surprise attack against Israel on the Jewish holy day of Yom Kippur. Following the outbreak of hostilities, both the United States and the Soviet Union initiated massive resupply efforts for their allies (Israel and the Arab states respectively) during the war which led to a confrontation between the two nuclear-armed superpowers.

Source: Bloomberg, SpringTide

Incrementum included a thoughtful, far-reaching interview with former Credit Suisse economist Zoltan Pozsar.  Pozsar is a Hungarian-American economist known for his analysis of the global shadow banking system.  He published a widely read December 2022 analysis while at Credit Suisse entitled “War and Commodity Encumbrance”.

Pozsar has since started his own macroeconomic advisory firm specializing in funding and interest rate markets called Ex Uno Plures.  The firm’s name (“out of one, many” in Latin) is the antonym of E Pluribus Unum (“out of many, one”), the motto on the Great Seal of the United States and dollar bill.  The firm’s raison d’être and the main thesis of the War and Commodity Encumbrance whitepaper is that “for generations, investors have been operating in a unipolar macroeconomic environment, where the U.S. dollar reigned supreme globally and where E Pluribus Unum was the perfect motto to describe what became known as the global dollar cycle. However, the conflict between the U.S. and China is set to reshape the global monetary order centered around the U.S. dollar. De-dollarization, the re-monetization of gold, the invoicing of a growing number of commodities and goods in renminbi, and the proliferation of CBDCs (Central Bank Digital Currencies) will challenge the US dollar’s hegemony (“out of one, many”).”

Incrementum’s headline quote from the Pozsar interview reads, “Two percent inflation and going back to the old world, I don’t think it stands a snowball’s chance in hell. Low inflation is over and we’re not going back.”

Here are some of Pozsar’s specific recommendations from the interview for adapting to the New World Order as he sees it (emphasis added):

  • We are moving into a multipolar reserve-currency world where the dollar will be challenged by the renminbi and the euro for reserve currency status.
  • These currencies, especially the renminbi, would not necessarily be used as a reserve currency, but rather to settle trade. Gold could play an increased role here. (Pozsar notes that since 2016-17, the renminbi has been convertible to gold on the Shanghai and Hong Kong Gold Exchanges.)
  • The Chinese are using swap lines to settle international trade accounts. This is a fundamentally different approach from the dollar reserve framework and would mean that trade can occur in renminbi without nations needing to hold vast reserves of the currency.
  • The various crises that today’s financial market participants have witnessed were solved by throwing money at whatever problem arose. The current inflation problem is different.
  • This situation is also vastly different from the late 1970s when Paul Volcker curbed inflation by prolonged high-interest rates. Chronic underinvestment in the resource sector and labor issues will cause inflation to remain sticky.
  • The traditional 60/40 portfolio allocation will struggle in this environment. Pozsar recommends a 20/40/20/20 (cash, stocks, bonds, and commodities) allocation.

Commenting further on the commodities allocation Pozsar echoed the words of Dalio on “gold, inflation and growth”:

“Within that commodities basket, I think gold is going to have a very special meaning, simply because gold is coming back on the margin as a reserve asset and as a settlement medium for interstate capital flows. I think cash and commodities is a very good mix. I think you can also put, very prominently, some commodity-based equities into that portfolio and also some defensive stocks. Both of these will be value stocks, which are going to benefit from this environment. This is because growth stocks have owned the last decade and value stocks are going to own this decade. I think that’s a pretty healthy mix, but I would be very careful about broad equity exposure, and I would be very careful of growth stocks.”

Servant Financial client portfolios have long held, meaningful allocations to gold.  Below is a summary of gold allocations by client portfolio risk profile:

The chart below provides the performance of a Moderate Risk client portfolio after management fees against a traditional 60/40 global composite portfolio (without management fees) over the past twelve months ended October 20, 2023, and highlights the benefit of holding traditional gold and precious metals and digital gold over this time. (Past performance is not indicative of future performance.)

Moreover, bitcoin broke emphatically through the $34K level on October 24, 2023, and is up some $8,400, or 32%, in the past 30 days after the United States Court of Appeal issued a court mandate this week requiring Grayscale Investment’s application for a spot Bitcoin exchange-traded fund (ETF) to be reviewed by the Securities and Exchange Commission (SEC).  The mandated SEC review could potentially pave the way for the conversion of the Greyscale Bitcoin Trust (BTC) from a trust (trading a week ago at a 12% discount to the net asset value (NAV) of underlying bitcoin held) to a spot ETF trading much closer to NAV. Servant predicted this “Bitcoinalization” as we coined it back in July of this year.

The title of this month’s newsletter is a hat-tip to the highly successful “Got Milk?” ad campaign of the 1990s and early 2000s.  Trends in consumption and investment evolve, affected by the cyclical and episodic nature of humanity and a myriad of factors from health and ethical concerns to technological innovations and geopolitical events. Just as the dairy industry has faced challenges and adapted, the gold investment landscape is also undergoing a transformation and monetary renaissance. The intrinsic value of milk as a household staple of a well-balanced diet is akin to the enduring value that gold brings to a well-diversified investment portfolio.  Just as there have been resurgences in milk consumption through innovation and adaptation, the allure of gold, gold miners, and other scarce stores of monetary value remains. A “Got Gold?” mindset offers investors a timeless refuge, especially in an era characterized by economic uncertainties, inflation, and geopolitical unrest.


Blessing for Peace

May those who make riches from violence and war,

Hear in their dreams the cries of the lost.

Excerpt from the poem by John O’Donohue


Hike Spike: Navigating REIT Sector Amidst Soaring Interest Rates

Introduction

Since March of 2022, the Federal Reserve has lifted its benchmark interest rate 11 times and held rates steady only twice at its regularly scheduled meetings, including this past September’s pause.  With the Federal Reserve’s interest rate hiking campaign seemingly nearing an end at a 22 year high for the Federal Funds Rate of 5.25% to 5.50%, we thought we’d take a fresh look at the Real Estate Investment Trusts (REITs) sector.  REITs have become a more common investment choice for investors looking to diversify their portfolios from traditional 60%/40% stock and bond portfolios. A REIT is a company that owns or operates real estate. The real estate owned ranges widely from office buildings, shopping malls, and hotels to warehouses, data centers, and storage facilities. REITs are attractive to investors because they provide efficient and liquid access to real estate investing without requiring actual ownership or management of real estate properties. REIT companies allow investors to purchase minority interests in their real estate portfolios and essentially hire the executive team and employees to manage the properties on their behalf. REIT investors typically receive consistent and strong dividend payments, share price appreciation, tax benefits, and a hedge against inflation. REITs can avoid double taxation through dividend-paid deductions. REIT companies are required to distribute at least 90% of their taxable income to shareholders through dividends for the REIT to avoid corporate-level taxation. This structure allows investors to receive real estate income without the burden of double taxation.  In other words, REIT investors should receive higher dividend distributions than under a corporate-level taxation regime.


Types of REITs

REITs come in various types and specialize in many different types of properties. According to NAREIT data, the predominant categories of REITs today include Infrastructure and Industrial, Residential, Retail, Healthcare, and Office.

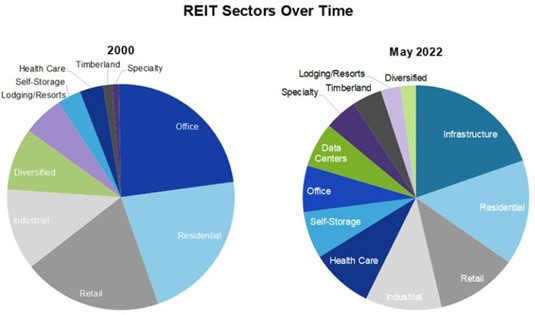
The chart below summarizes the comparative REIT components from 2000 and May of last year and highlights the changes in the largest real estate asset classes over time:

Source: National Association of Real Estate Investment Trusts (NAREIT)


Infrastructure and Industrial:  Infrastructure REITs own and manage infrastructure real estate and collect rent from tenants that occupy that real estate. Infrastructure REITs’ property types include fiber cables, wireless infrastructure, telecommunications towers, and energy pipelines.  Industrial REITs own and manage industrial facilities and rent space in those properties to tenants. Some industrial REITs focus on specific types of properties, such as warehouses and distribution centers. Industrial REITs play an important part in e-commerce and are helping to meet the rapid delivery demand.  We’ve grouped these together since one type is essential a network for transferring information while the other is a network for transferring goods.  These REIT sectors are a growing part of today’s modern economy.

Residential: Residential REITs or Multifamily REITs invest in manufactured housing and apartment buildings. They both offer affordable alternatives to home ownership which satisfies a seemingly never-ending demand for younger Americans just entering the workforce.  Affordable housing is another non-discretionary item and there will always be a base level of demand. Residential REITs succeed the most when they invest in areas where home costs are too expensive or impractical and centrally located apartments are in high demand. Cities such as Chicago and New York are prime residential REIT investment examples. If there is consistent demand for apartments over homeownership, Residential REITs will find success.

Retail: Retail REITs invest in shopping malls, strip malls, and other retail outlets. Revenue is received from monthly rent payments from retail tenants.  This leasing aspect makes it important for Retail REITs to try and pick optimal store tenant mix and locations that maximize the amount of foot traffic to their retail properties. Amazon is making it increasingly difficult for most traditional retail department stores to remain profitable and in business.  Think of Sears and K-mart.  Retail REITs need to invest wisely in properties and tenants that are less impacted by online shopping. This includes high-traffic areas such as urban malls, popular tourist shopping areas, and necessity-based or non-discretionary stores for frequent recurring purchases (convenience stores, pharmacies, grocery stores, etc.). Areas that REIT companies tend to shy away from are areas with high vacancy rates, lack of accessibility either pedestrian or car traffic, and areas of economic decline and high crime rates.  For example, Target made headlines this past week with their announcement to close nine stores across four states because of theft and crime.  The Minneapolis-based company will close locations in the Harlem neighborhood of New York City, Seattle, Portland and the San Francisco Bay Area effective Oct. 21.

Healthcare: Healthcare REITs invest in hospitals, clinics, retirement homes, and skilled nursing facilities. Again, given favorable U.S. demographics, particularly an aging Baby-Boomer generation, there is going to be consistent demand for healthcare services which brings stability and success for Healthcare REITs that own the real estate assets leased to retirement home and skilled nursing providers. Increased demand for healthcare, such as with the COVID-19 pandemic, may lead to better performance for Healthcare REITs with variable rent components based on sales. In addition, life expectancies continue to increase which means the older population keeps growing. Since older people require more healthcare and nursing/retirement home services, there is an overall increase in demand for healthcare which has boosted the performance of Healthcare REITs in recent years.

Office: Office REITs invest in office buildings and collect monthly rental income from tenants. These tenants are generally businesses and companies with centrally located offices to drive employee collaboration. As more and more companies are introducing remote work environments, office vacancy rates have increased in recent years which has put significant pressure on the Office REIT sector. Office vacancy rates have climbed across all of the major U.S. cities, led by San Francisco’s increased vacancy rate of nearly 20%.  The Visual Capitalist stated that it is anticipated that by 2030, over 300 million square feet of U.S. office spaces will be obsolete. Other factors such as the unemployment rate and economic performance can also directly affect the performance of Office REITs.


REIT Yields and Comparison to Farmland

REITs have traditionally provided investors with consistent dividend income and appreciation potential. The amount and variability of rental income depends on the type of REIT and the overall sector performance at the given time.  We’ve tried to highlight the differences in REIT income sources above between those that a predominantly non-discretionary in nature like Residential REITs and those REITs with higher variability in rental streams like Office and Retail REITs.

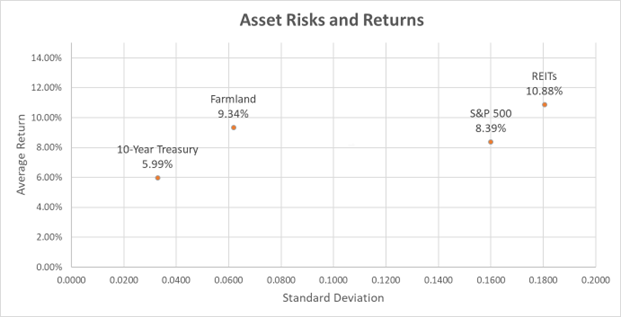
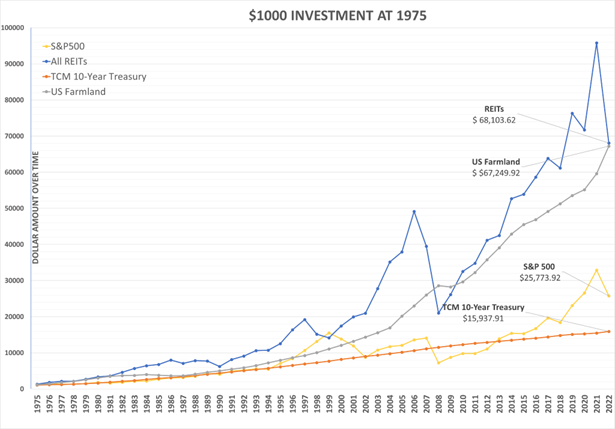
Using data compiled from the TIAA Center for Farmland Research, we’ve compiled performance data below for REITs, farmland, 10-year U.S. treasury, and the S&P 500 for the last nearly 50-year period (since 1975).  REITs (averaged from all types) average annual total return of 10.88% per year while farmland provided an average annual return of 9.34% nationally. While REITs offered the highest annualized return over this period, it was also the most volatile of the four assets as measured by the standard deviation of its returns at 18%.  REIT volatility surpassed the S&P 500 of 16%.  Farmland outperformed all of the other asset classes on a risk-adjusted basis with its annual return of 9.34% but with only a third of the volatility of REITs at 6%.

The performance of most REIT sectors are more variable than farmland depending on economic factors such as interest rate fluctuations and supply and demand changes. REITs are considered an interest rate sensitive asset class much like the utility sector. For example, the largest REIT ETF is Vanguard REIT Index (VNQ). VNQ’s year-to-date returns through August 2023 are measly 1.9% total return with a one-year annualized loss of -7.3% and two-year loss of -9.7%. On the other hand, farmland has generally continued to appreciate in 2022 and 2023 based on the favorable trends in farming income. Farmland stability comes from the constant need for food and the fact that it’s uncorrelated with other asset classes, but highly correlated with inflation as measured by the Consumer Price Index (CPI).

Source: https://farmland.illinois.edu/research-briefs/


As the chart depict below, REITs have still given farmland a run for their money albeit with more volatility producing a value of $68k for $1k investment in 1975.  Farmland was a close second at $67k outcome for your $1k. However, the stability of farmland returns is noticeable from the chart.  Farmland generates income from agricultural activities which have relatively lower capital expenditures and income potential compared to income-generating properties like multifamily apartments or commercial office buildings. REITs will have much more capital expenditures for repair and maintenance of building structures whereas farms are mostly land with farm structures generally approximating 5% to 10% of the value of the farmland. Investors generally require higher yields from REITs because of the higher Capex requirements and the higher risk of obsolescence.  Think Office REITs and some Retail locations and business models. In theory, investors should therefor require a lower risk premium for farmland given its lower volatility as compared to REITs, but there is limited available data to support this assertion.

This graph shows the growth of a $1000 investment in 1975 over time. If you invested $1000 into each of these 4 asset classes, you would get the most return out of REITs and farmland.

Source: https://farmland.illinois.edu/research-briefs/


The State of REITs

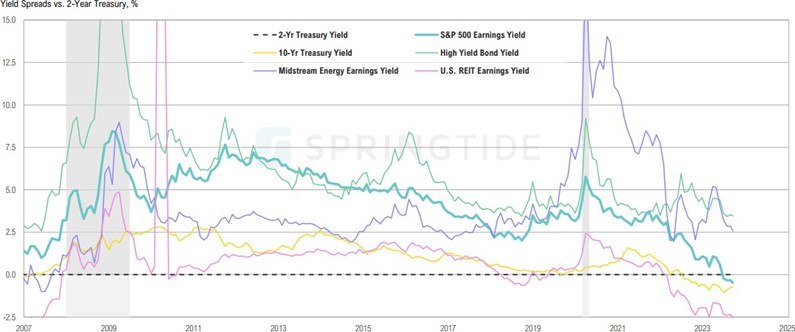
Servant Financial’s institutional investment research partner SpringTide Partners recently conducted a review of state of interest rate sensitive real estate sector considering the Fed’s hike spike in interest rates.  SpringTide examined REITs, midstream energy, and S&P 500 earnings yields (E/P, or cap rate) to 2-year and 10-year U.S. Treasury yields.  Below is a chart of the spread between these earnings yields and the 2-year treasuries.    You’ll note that for REITs the current yield spread is roughly -2.5%. This spread to 2-years hasn’t been this negative previously until just prior to the 2008-9 global recessionary period and the Global Financial Crisis. In that era of Fed policy mismanagement, REITs yield spreads blew out almost 7.5 percentage points from -2.5% in 2007 to just shy of 5.0% in 2009.  This graph also demonstrates the yield spread of REITs compared to other asset yields.  You’ll also note that yield spread to 10-year treasuries and S&P 500 is also negative for the first time since 2007.  In other words, investors are not receiving a risk premium over 2-year treasuries for investing in either REITs, long-term treasuries (no term premium), and S&P 500.   This analysis suggests investors would currently be better off putting money into a savings account rather than REITs, 10-year treasuries, or the S&P 500.

Source: https://springtide-partners.com/


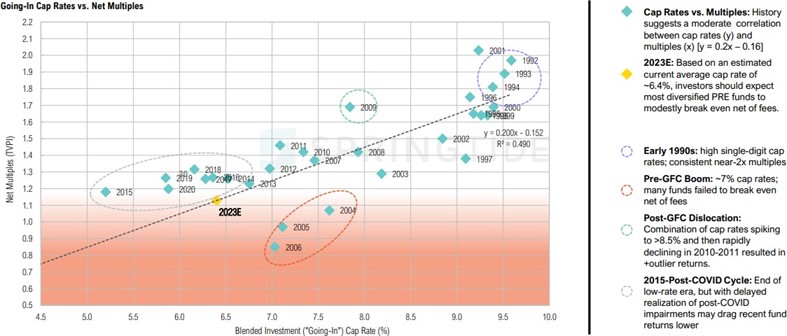
This chart below demonstrates that the historical entry/purchase cap rates for REITs are a key determinant of an investor’s exit net multiples. The cap rate is computed as the net operating income of a REIT divided by the purchase price at time of entry. Higher cap rates suggest higher risk at the time of purchase and increased risk premiums relative to risk-free treasuries. REITs today are trading at 6.4% cap rate, or earnings yield.  According to this chart, investors who buy REITs at the current 6.4% cap rate would be lucky to break even much like where the 2015-post-COVID cycle investors who bought in.  Alternatively, the historical sweet spot to invest in REITs was in the early 1990s and the pre- and post-Dot.com bust of the late 1990s and early 2000s when entry cap rates were roughly 9.5% compared to today’s 6.4%.


Source: https://springtide-partners.com/


Conclusion

REITs have gained popularity amongst investors for their portfolio diversification benefits. They offer exposure to a range of real estate sectors and risk profiles, such as retail, residential, healthcare, office, and infrastructure/industrial. While REITs have provided historically attractive average annual returns since 1975, other investment options, such as short-term U.S. treasuries, money market funds, farmland, or high-yield bonds, look more attractive on a risk-adjusted basis in our current economic state. High-interest rates are drastically affecting the performance of REITs, particularly those REITs with higher leverage, interest rate risk, and near-term refinancing exposures. Our recommendation is that REIT investors remain patient and await the Fed’s “hike spike” to work its way into REIT entry cap rates.  Based upon recent history, a move in REIT yield spreas over 2-year treasuries of 2.5% to 5.0% seems “real”-istic.

Bitcoinalization: The Coming Institutionalization of Bitcoin

The digital economy is an umbrella term that describes how traditional brick-and-mortar activities are being disrupted or altered by the Internet and blockchain technologies. The institutionalization of digital assets throughout history has been driven by various factors, including shifts in investor risk preferences or changes in economic conditions, but most importantly by advancements and convergences in technology and related network effects. Network effects are a phenomenon whereby a product or service gains additional economic value as more people use it.  Think of social media networks Facebook and Twitter, e-commerce platforms like Amazon or Apple’s app store and iPhone, or digital payment platforms like PayPal, Venmo, or Bitcoin.

The institutionalization of “tangible” digital assets began with the proliferation of digital real estate assets over the last few decades. The emergence of these new real assets has been driven by a massive secular movement from analog to digital systems and the development of real assets and infrastructure to support the digitization of economic activities and an ever-increasing array of new digital technologies. Below are a couple of examples of ubiquitous digital real estate assets that have emerged over recent decades:

Cell Towers: Cell towers are perhaps one of the earliest examples of new digital real assets that have undergone the institutionalization process. As mobile communication technology has developed to meet business and consumer demands for greater bandwidth and rich features, a massive infrastructure buildout has occurred to support network reliability and responsiveness. Cell towers provide the infrastructure necessary for wireless communication networks, and they generate revenue through leasing agreements with telecommunication service providers.

Institutional investors recognized the combination of stable income and the growth potential of cell towers and began investing in the asset class. Tower companies, REITs, and infrastructure funds were formed to acquire and manage portfolios of cell towers. We witnessed the successful development of this nascent asset class in the mid-2000s through a family office advisory relationship for which we oversaw a private equity fund exit of a private cell tower business to Crown Castle International (NYSE: CCI) for $5.8 billion and very rich multiples on invested capital and tower cash flows. These entities focus on leasing tower space to telecommunication companies, effectively creating a stream of relatively stable and growing rental income. Co-location of cellular equipment from multiple carriers on a single tower created interesting upside optionality and ultimately outsized returns for early cell-tower owners and investors.

Data Centers: With the rapid growth of the digital economy, data centers have emerged as a critical infrastructure asset necessary to support the increased digitization of communication and storage and retrieval of exponentially larger data elements. Data centers provide the physical infrastructure to store and process large amounts of digital information. Institutional investors recognized the increasing demand for data storage and processing capabilities, leading to the development of specialized data center investment firms and funds.  Like cell towers, specialized public corporations and REITs were formed to hold these data center assets, such as Equinix, Inc. (Nasdaq: EQIX) and Digital Realty Trust, Inc. (NYSE: DLR)

Concurrently, Amazon was developing its own data center expertise and infrastructure in support of its online book-selling business and expansion into other consumer products. Ultimately, Amazon was able to monetize its cloud-computing and data center expertise by building out a hugely profitable outsourced data center management business within Amazon.com (NYSE: AMZN) called Amazon Web Service, or AWS for short. This unique company’s specific transformation illustrates the powerful confluence of learning curves, technological reinforcement, economies of scale, and/or network convergence that can be associated with the digitization of the economy.

The institutionalization of these two asset classes involved the entry of large-scale institutional investors, such as pension funds, insurance companies, venture capital, and private equity firms, who brought significant capital and professional management expertise. They often acquired substantial portfolios of assets within the specific asset class, creating economies of scale and professionalizing operations.

The institutionalization process typically involves the standardization of investment structures, the development of specialized investment vehicles (for example, the more tax-efficient REIT structure for holding qualifying real estate assets), and the establishment of industry best practices. Very often adjustments in the existing regulatory framework and industry practices are necessary to bridge compliance gaps. The institutionalization process generally contributes to increased liquidity, transparency, and stability within an asset class, ultimately making it more attractive to a wider range of investors.  The REITs cited earlier are examples of these institutional market forces.  I think one important lesson from this history is that you want to be an early investor in these emerging digital asset classes prior to the formation of public REIT structures that democratized the asset to the masses.

Importantly, smaller, and more nimble retail investors have a distinct advantage over institutional investors if they can identify the approaching institutionalization of an asset class in advance of the institutional capital pools and have the fortitude to invest in an emerging digital asset in the early adopter phase of the S-curve adoption patterns commonly taught in university business classes. The early adopter phase is typically after proof of concept but prior to mass market adoption and the large institutional capital flows.

As we’ve all experienced firsthand with the emergence of mobile communication enabled by cell towers and cloud computing enabled by data centers, the adoption rate of digital innovations tends to be non-linear.  Adoption is generally slow at first driven by a small group of innovators. Adoption rates then  torise rapidly as early adopters and then the early and later majority come on board in the mass market phase before adoption flattens out in the maturation phase.  These traditional S-curve innovation adoption rate concepts are graphically depicted below:
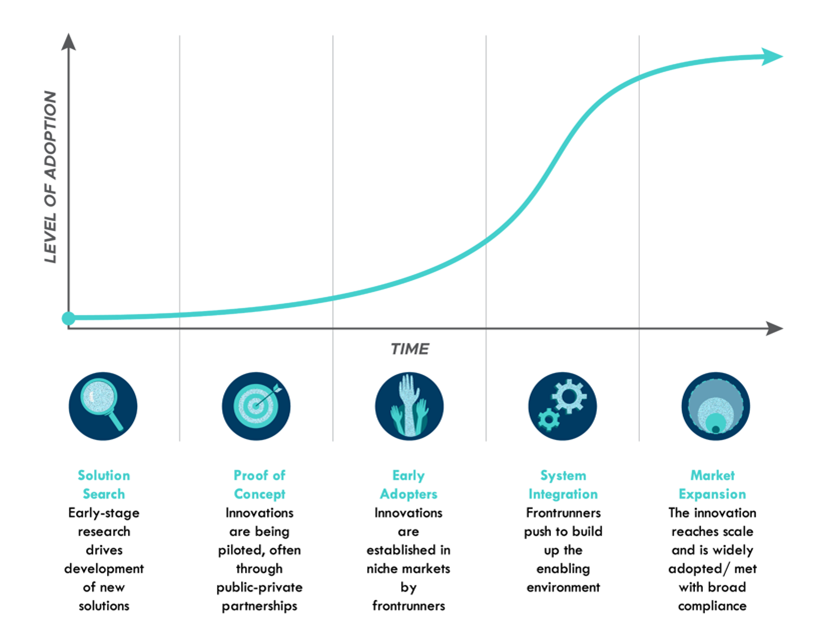
Levels of Adoption: Solution Search/Innovators: <2.5%, Proof of Concept/Early Adopters: 2.5% to 13.5%, System Integration/Early Majority: 13.5% to 50.0%, Market Expansion/Late Majority: 50.0% to 84%, and Laggards – last 16%

Source: Rocky Mountain Institute, “Harnessing the Power of S-Curves”

Bitcoinalization

According to a June 2022 analysis of Bitcoin User Adoption by Blockware Solutions, somewhere between 1% to 3% of the global population are bitcoin users/holders.  This is a broad approximation because one on-chain entity could be a single person that self-custodies their bitcoin or it could be an exchange, custodian desk, or other institution that represents thousands or potentially millions of individuals.

Blockware Solutions’ analysis puts Bitcoin somewhere in the Early Adopters phase in the S-curve paradigm. System Integration is the next phase in the cycle and with it comes mass-market adoption.  From this standpoint, bitcoin is at a critically important inflection point in its history.  We’ve “coined” this coming wave of institutional adoption as bitcoinalization.

Before going into our investment case further, let’s look at the institutionalization process of a purely digital networked business more like bitcoin and distributed ledger technology (DLT) to supplement the foregoing tangible cell tower and data center examples. Some important patterns and potential impediments for future Bitcoin user adoption may become apparent.

One technology-enabled asset class institutionalization process that can be seen as an analogy for Bitcoin and DLT is the emergence of the Internet and the subsequent development of the digital advertising industry.  As can be seen from the digital real estate examples, the Internet revolutionized the way information is shared, communicated, and accessed. The World-Wide Web provided a platform for new business models and created opportunities for new and innovative asset classes. One of these asset classes is digital advertising, which grew alongside the expansion of the Internet and digital real estate assets and infrastructure.

Correspondingly, bitcoin and DLT would not be possible without the Internet and associated global communication and data processing networks.  Bitcoin and DLT have transformed the financial landscape by introducing decentralized digital currencies and distributed ledger systems. Bitcoin, as the first and most well-known cryptocurrency, paved the way for the institutionalization of digital assets and the exploration of blockchain-based technologies or distributed ledgers.

Similarities between the institutionalization processes of digital advertising and Bitcoin/DLT include:

Disintermediation: Both digital advertising and Bitcoin/DLT aim to eliminate intermediaries, reducing the need for trusted third parties. In digital advertising, the traditional intermediaries, advertising agencies, were bypassed as digital platforms enabled direct connections between advertisers and consumers. Similarly, Bitcoin and DLT aim to create a trustless system where transactions can occur directly between participants without financial intermediaries, such as banks or other financial institutions.

Growing Institutional Interest: Over time, digital advertising gained significant institutional interest as advertisers and marketers recognized its potential for more targeted, cost-effective advertising, and more discernable return and payback metrics. Similarly, Bitcoin and DLT have attracted venture capital firms, technology companies, and other traditionally early investors that recognized the potential for decentralized finance, secure, immutable transaction processing, and other benefits of blockchain technology.

Initial Skepticism and Regulation: Both digital advertising and Bitcoin/DLT faced initial skepticism and regulatory challenges. Digital advertising faced scrutiny, and regulatory frameworks needed to adapt to new forms of online advertising to address consumer protection and privacy concerns. Similarly, bitcoin and cryptocurrencies encountered market skepticism and continue to face regulatory scrutiny as the Securities and Exchange Commission (SEC) and other financial regulators seek to better understand and regulate this new asset class.

Importantly, it’s in this regulatory oversight where we have just recently seen a potential framework developing for much-needed regulatory clarity. The SEC has long come under fire for its approach of regulating crypto markets by enforcement, rather than providing proactive, definitive regulatory guidance. After arguably being found asleep at the wheel in the aftermath of the FTX debacle, the SEC has become a more consistently active regulator. In a watershed event, the SEC sued Coinbase (NASDAQ: COIN) and Binance, two of the world’s largest crypto exchanges, in June 2023 for allegedly breaching SEC securities regulations. The SEC alleged Coinbase traded at least 13 crypto assets that the SEC deemed to be securities which should have been registered with the SEC. (Ironically, the SEC reviewed Coinbase’s initial public offering of securities in April 2021 and did not object to the Company’s public listing.)  The SEC accused Binance of offering 12 cryptocurrencies without registering them as securities.

The SEC’s litigation claims center around whether crypto tokens represent investment contracts and/or securities. Given the technological innovations and new business models involved with crypto assets, this is a substantially gray area that will ultimately be decided by the courts. Just last week a judge ruled in a split decision in the SEC’s earlier lawsuit against Ripple that Ripple’s XRP token was a security sometimes.

Although there has been a long-running debate as to whether some cryptos are securities, there has been very little argument from the SEC that Bitcoin is a security. The Commodity Futures Trading Commission (CFTC) ruled in 2018 that “virtual currencies, such as bitcoin, have been determined to be commodities under the Commodity Exchange Act (CEA)” in its Bitcoin Basics brochure.

Despite this seeming clarity for bitcoin’s treatment as a commodity, the SEC has denied dozens of registrations for spot bitcoin exchange-traded funds (ETFs) of commodity-based trust shares over the last few years.  Paradoxically, the SEC has allowed numerous ETFs based on bitcoin futures to trade on regulated exchanges but has denied every spot bitcoin application that has been submitted to date. The SEC has often cited that the underlying spot market of Bitcoin is subject to fraud and manipulation. Since the derivatives market reflects spot prices, it is difficult to see the SEC logic in allowing the futures-based ETFs but not ETFs based on the underlying bitcoin.

However, it seems that regulatory clarity is about to arrive for Bitcoin with the recent submission by Blackrock (NYSE: BLK) for a spot Bitcoin ETF.  We see the SEC approval of a spot bitcoin ETF akin to the REIT structure that democratized cell tower and data center ownership to the masses. Blackrock is the world’s largest investment manager at $9 trillion in assets under management (AUM).  It’s CEO, Larry Fink, was an early skeptic and once declared, “Bitcoin is nothing more than an index for money laundering.”  Funny how profit incentives and client defections to your competitors providing Bitcoin access will change your tune.

On July 13, the SEC added BlackRock’s spot Bitcoin ETF application to its list of proposed rulemaking filings for the NASDAQ stock market. This move may signal the SEC’s intent to take the application more seriously after BlackRock added a “surveillance-sharing” agreement with U.S. crypto exchange Coinbase to its updated application. Blackrock’s competitors Fidelity Investments, WisdomTree, Invesco, VanEck, and others have followed suit and filed similar “surveillance-sharing” amendments to their respective bitcoin ETF applications. Several of these other bitcoin ETFs were recently added to the SEC’s review docket.

It is particularly interesting to note that both the NASDAQ exchange and CBOE are partnering with Coinbase to provide the market surveillance function to address SEC concerns about monitoring of fraud. The Coinbase name was originally omitted in Blackrock and other bitcoin ETF applications, possibly due to the SEC’s wide-ranging enforcement action against Coinbase.

In addition to the spot bitcoin ETFs, there have been several other positive institutional moves that may also promote bitcoinalization:

  • Not to be left out, rumors abound that Vanguard ($7.6 trillion in AUM) may potentially take over the Grayscale Bitcoin Trust (GBTC) and convert it into a spot ETF.
  • Last September, Fidelity Investments, Schwab and Citadel announced they were teaming up to launch a new crypto exchange called EDX.
  • Fidelity Investments is no stranger to bitcoin. Fidelity has been leading the institutional adoption of bitcoin. For example, Fidelity has its own bitcoin mining operation. And since early last year, Fidelity has enabled their 73,000 retirement plan clients to make bitcoin allocations with 401K plans where Fidelity acts as the custodian or administrator.
  • More recently Fidelity Investments began rolling out Fidelity Crypto® capabilities to its Fidelity Institutional Registered Investment Advisory (RIA) network and family office clients by providing access to Fidelity Digital Assets custody and execution services within the RIA Wealthscape platform.


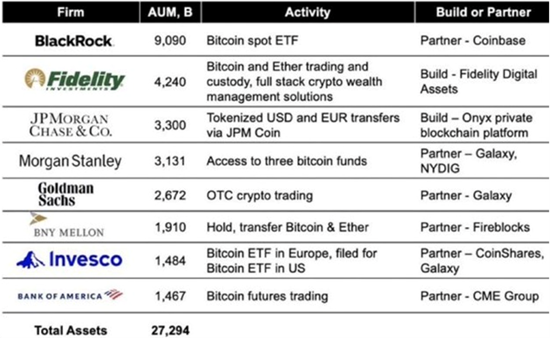
All the foregoing developments are elegantly summarized in the following chart from BitcoinNews.com. Led by Blackrock and Fidelity, the following institutions which control some $27 trillion in assets under management are queuing up to invest in a scarce 21 million bitcoin (19.4 million in existence and 1.6 million left to be mined).
Considering the foregoing, we will be taking the following actions on behalf of our Servant Financial clients:

  1. Doubling portfolio allocations to the bitcoin sector – initial client allocations based on account risk tolerances were to Grayscale Bitcoin Trust (OTC: GBTC) ranging from 1% to 2% and Hut8 Mining (NASDAQ: HUT) of 1.5% to 2.0%,. HUT’s stock price has doubled in the last 45 days on the bitcoin rally on news of Blackrock’s ETF filing and company specific merger developments.  We’ve simply doubled the HUT allocation in more risk-tolerant client accounts that hold this security without making additional share purchases.  Concerning the direct bitcoin allocation, we are withholding action on any additional GBTC allocations until we’ve had an opportunity to meet with Fidelity Investments on the Fidelity Crypto® integration for registered investment advisors.  Initially, Fidelity will not be charging custodial fees for cold storage of client Bitcoin or Ethereum.  Over time, Fidelity intends to charge 0.4% for Bitcoin and Ethereum custody. GBTC charges a 2% annual management fee.
  2. Continuing Professional Education – taking an online course for a certificate in blockchain and digital assets for financial advisors offered by Digital Asset Council for Financial Professionals.
  3. Ongoing securities research – analysis of other leading “picks and shovels” companies in the bitcoin and blockchain ecosystem like HUT. We are beta-testing a more speculative pure-play model invested in six companies for one client.
  4. Convergence of bitcoin miners and their high-performance computing capabilities with artificial intelligence applications – it’s a story for another day but a convergence of artificial intelligence and bitcoin mining/high-performance computing is anticipated. It seems that bitcoin mining equipment is uniquely suitable for artificial intelligence applications, particularly NVIDIA graphics processing units (GPUs, initially developed for gaming and graphics applications) with application-specific integrated circuits (ASICs) for bitcoin mining. Some miners established early strategic relationships with NVIDIA (NASDAQ: NVDA).

“I love this stuff – bitcoin, Ethereum, blockchain technology – and what the future holds.” – Abigail Johnson, granddaughter of the late Edward C. Johnson II, founder of Fidelity Investments.

And just like that bitcoin is institutional – bitcoinalization.

Summer Road Trip

The summer season has officially begun and following in the footsteps of the Griswold family, you’ve decided to take a typically American road trip. But instead of a final destination of Walley World, your destination is a more durable investment portfolio as you suspect the wheels may come off the US economy this summer. Fasten your seat belts, get out your road map, and drive along as we explore some of the key points of interest (POI) for the U.S. economy this summer.

First POI: National Debt Ceiling

One POI that could cause you to reduce your cruising speed this summer could be the National Debt Ceiling. The media and public have been in a veritable frenzy over the past month about the National Debt Ceiling as the legislative and executive branches of government have until June 5th to reach a compromise on raising the national debt limit. The U.S. Government reached its $31.4 trillion debt limit in January however the Treasury Department has been using “extraordinary measures” and accounting tricks to avoid a technical default. The U.S. Treasury Department recently warned that if the ceiling were not raised by June 5th, the U.S. Government could default on its payment obligations to debt holders.

About $6.8 trillion of this debt is owed to other federal agencies such as the Social Security Trust Fund, the Federal Old Age and Survivors Insurance and Federal Disability Insurance Trust Funds, and the Military Retirement Fund. The remainder is held by the public. Among these public debtholders are U.S. banks, investors, the Federal Reserve, state and local governments, mutual funds, pension funds, and several foreign governments. Almost half of U.S. debt is held in trusts for retirement, meaning if the U.S. government ever defaulted, it could have far-reaching impacts on current and future retirees. Much like you, these retired workers are likely looking to hit the road in their RVs this summer.  Some sharp-eyed retirees may have foreseen this speed bump ahead and begun rethinking their travel plans.  Many have pulled over into the relative safety and comfort of a rest area; tired and frustrated that their retirement income lies in the hands of politicians jockeying to ride shotgun beside the Commander in Chief.

Source: The Balance Money

In addition to military leadership, the Commander in Chief holds primary responsibility for the conduct of U.S. foreign policy.  Stiffing your foreign lenders would be a steering error with potentially fatal consequences.  Japan, China, and the United Kingdom lead the line of geopolitical traffic cops, collectively holding over $2 trillion of U.S. debt. Japan and China’s large holdings of U.S. debt help support the value of the dollar as the global reserve currency and finance U.S. purchases of their relatively cheaper goods. The U.S. economy is one of the key global economies as most foreign countries have some trading relationship with the United States.  In addition, the U.S. dollar dominates global exchange markets, representing 90% of trading volume.  A U.S. default on its national debt would cause a major economic pileup and delays in global economic activity transmitted through the U.S. dollar-based global financial system. The U.S. maintained its AAA or equivalent credit rating by the major reporting agencies until the last debt ceiling crisis in 2013, when Standard and Poors downgraded the U.S. to an AA+ credit rating, citing political brinkmanship over raising the Federal debt ceiling.

Source: The Balance Money

Thankfully, legislators have reached a proposed deal that would lift the federal debt limit; however, the proposed legislation will do little to reduce the government spending that sped up during the COVID-19 pandemic. The package would suspend the borrowing limit until January 2025 along with limiting military spending growth to 3% and imposing limits on nonmilitary spending. Some other features of the deal include some cutting of funding for the Internal Revenue Service and a tightening of work requirements for the Supplemental Nutrition Assistance Program. The deal still needs to be approved by both the House and Senate before going to the Commander in Chief for his signature. At this juncture, it seems likely that these two backseat drivers will reach agreement soon enough to apply the brakes and avoid a catastrophic Thelma & Louis ending.

Second POI: Revisiting Cryptocurrencies

Next stop on our summer road trip, is a place we have visited before, cryptocurrencies. At the end of 2022, we discussed some of our key investment themes for 2023 with crypto assets making the list. Cryptocurrencies, such as Bitcoin and Ethereum, were on everyone’s POI list last summer.  However, the epic failure and fraud of one of the largest digital currency exchanges, FTX, halted many people’s crypto ride prematurely. The price of Bitcoin fell 65% last year but has it started to make a comeback? The short answer is yes however it has not yet reached its all-time high of 2020. Bitcoin is up 67% year to date with Ethereum following suit, rising almost 59% year to date. While crypto assets are increasing in popularity again after their self-inflicted pileup last year, many remain skeptical about whether alternative currencies are the safest route on the investment highway. Similar to old Route 66 that runs from Chicago, Illinois to Santa Monica, California, digital currencies have had several bumps, potholes, and dead ends across its history. Still, Route 66 remains a viable, albeit alternative pathway.  It has not been abandoned by more adventuresome travelers.  Inflationary pressures and a long history of fiat-based monetary accidents have venturous investors exploring these digital assets for diversification benefits as uncertainty looms around the U.S. economy and recession odds grow with the length of days. We expect to see more sensible government regulation in this space over time. The stakes have been raised with SEC cracking down on the popular trading and exchange platform, Coinbase, in April.  Congressional leaders from both sides of the aisle have been working on providing legislative clarity where the SEC has left a regulatory vacuum.  Cryptocurrencies may not be on everyone’s destination list this summer; however, we will be keeping a watchful eye on their route this summer.  The incessant drumbeat of global de-dollarization and circumventions of U.S. hegemony by U.S. allies and foes alike will be good fodder for economists’ ghoulish tales around summer campfires.

Third Stop: Energy Prices

From the air conditioning in your home to the gas tank filled up for that summer road trip, energy prices remain a stipulation in summer travel plans. Last year, energy prices, impeded many people’s ability to take that summer vacation or forced them to turn down the thermostats in their homes as the Russian-Ukrainian conflict put price pressure on oil and natural gas. Europe felt the brunt of spiking energy prices as its largest supplier of natural gas, Russia, shut off its pipes to countries supporting Ukraine in its war efforts. As a result, prices skyrocketed which sent shockwaves to energy consumers around the world. Thankfully, Europe pushed its populous to conserve energy, and, coupled with a mild Winter, the European Union was able to escape a possible pileup widely predicted this past winter.  Energy prices have largely stabilized along with the apparent stalemate in the Russia-Ukraine War with oil prices falling 7% and natural gas prices falling 42% since January 1st making your summer travel a bit cheaper going into the warmer months.

Fourth POI: Hospitality Industry

Our final stop is a look at the hospitality industry: the epicenter of summer travel season. The hospitality industry which includes hotels, bars, and restaurants took a major hit during the pandemic as restrictions and public fear kept many people locked down. However, the CDC recently lifted its Public Health Emergency as COVID-19 has become less virulent and more manageable from a public health perspective. This news couldn’t have been better timed for the hospitality industry as this summer is projected to be full of travel for Americans. A study conducted by Deloitte found that 50% of Americans plan to take trips this summer that include hotel or rental home stays along with many reporting they will be traveling internationally this year. As a result, bars, hotels, and restaurants are among the economy’s fastest-growing employers according to the Wall Street Journal. This hiring frenzy comes on the heels of increased consumer spending in April even though recessionary fears persist. Overall, much like this author, Americans seem to be making room in their budgets for that epic 2023 summer road trip making the hospitality industry one sector to watch this year.

“When all else fails, take a vacation.”  – Betty Williams

Hopefully, we’ve whetted your appetite for a summer road trip.  Let’s face it, our elected officials and central bankers are driving erratically and should get off the road.  Thankfully they’ll be on summer break soon, probably just as soon as they raise the debt ceiling.

There is an old Wall Street adage, “Sell in May and go away” that ties in well with this summer road trip theme.  Of note, we’ve tactically reduced Servant Financial model portfolios to the lower end of their risk tolerance range earlier this month to keep your summer road trip on track and carefree.  Although we cannot prevent government or Fed-induced market accidents from occurring, we can limit the portfolio damage.  With the S&P 500 trading at 4,200 and a rich 24 times last twelve-month price-earnings ratio (PE) and 19 times forward PE, selling in May and focusing on your summer vacation seems like a very sensible thing to do.

Contact us today to learn how you can keep your investment portfolios safely on the road this Summer.


white-arrow