Email us at info@servantfinancial.com to talk to a financial advisor today!

Email us at info@servantfinancial.com

Got Questions?

In the December 2022 newsletter, we featured “12 Investment Themes of Christmas” where we presented important forward-looking finance considerations for the approaching new year. We discussed economic themes surrounding interest rate trends, inflation, recession predictions, consumer spending, cryptocurrencies, and farmland among other topics. We thought a review of 2023 in the form of queries would be a good springboard for our themes for 2024 – a few questions before the quest for answers if you will.

 1. Are Fed Hikes Finished?

In a bold move to address decades-high inflation, the Federal Reserve added 1% to its benchmark federal funds rate by way of four 0.25% hikes, bringing its target rate to a new range of 5.25% to 5.5%.  However, the Fed has held its target rate steady since its last hike in July. These four increases follow a series of seven interest rate hikes in 2022 with the target rate ending 2022 at 4.25% to 4.5% up from 0.0% to 0.25% in March 2022.

The Fed appears to be done and will await the lagged effect of its aggressive hiking campaign.  It is commonly believed that monetary policy works with “long and variable lags” (Milton Friedman dictum) of up to 18 months after a rate increase.  Fed Chair Powell has made it clear that the Fed will retain rates at current high levels for an indeterminate period. Powell also left open the possibility of more rate hikes after the Fed’s mid-November meeting. The Fed will render its next interest rate decision in mid-December with the bond market expecting the Fed to remain on hold at this meeting.

The Fed’s commitment to addressing the challenges posed by inflation has been digested by the bond market with the market consensus of a first-rate cut pushed out until June 2024.  This is consistent with the Fed Reserve Board’s most recent dot plot for a median Fed Funds Rate of 5.1% for 2024.  But can we be certain that Fed hikes are finished?

2. Has Inflation Been Tamed?

The Fed’s aggressive interest rate hikes appear to be having a positive impact. Recent data reveals a notable drop in the inflation rate with the October 2023 headline Consumer Price Index (CPI) showing a 3.3% drop year over year. The headline CPI for 2023 currently sits at 3.2% with core CPI (less volatile food and energy) at 4.0%. This marks a significant improvement compared to the 6.5% headline inflation rate in 2022 but remains well above the Fed’s 2% inflation target. The slowing inflationary trend is great news for consumers and businesses. Lower inflation rates mean that the prices of goods and services are increasing at a slower pace, allowing consumers to make their hard-earned money go further.

While there are still challenges in the housing market with rising costs and slowing sales, the overall outlook suggests an optimistic shift toward lower inflation and eventually more affordable housing costs.  If the Fed has achieved its goal of a soft economic landing with CPI heading towards its 2% inflation target, then homebuyers can expect lower mortgage payments as the Fed interest rate cuts begin.  The Fed Reserve Board’s most recent dot plot for median headline PCE inflation (Personal Consumption Expenditures Price Index, the Fed’s preferred inflation measure) was forecasted at 2.5% and Core PCE of 2.6% for 2024.  But can we reasonably expect that inflation has been tamed by the Fed absent some sort of economic fallout?

3. Is A Recession Inevitable? 

Despite earlier concerns about a possible 2023 recession, the economic landscape has shown incredible signs of resilience and improvement despite the Fed’s rapid hiking campaign. Economic indicators such as unemployment rates and GDP growth are fundamental measures of a country’s economic health. The unemployment rate, which stood at 3.7% in 2022, has increased only slightly to 3.9% in 2023. This trend of modest softening of employment is consistent with the Fed Reserve board’s most recent dot plot for a median unemployment rate of 4.1% for 2024.  Fortunately, the GDP growth rate on the other hand has surged from 2.1% annual run rate to 4.9% in the third quarter of 2023. This strong GDP growth suggests an economy more resilient than Fed expectations with increased job opportunities and improved consumer spending.

The Fed Reserve Board’s most recent dot plot calls for median 2023 GDP growth of 2.1% and GDP growth slowing to 1.5% for 2024.

Amazingly, the Fed dot plots for interest rate policy, inflation, employment, and GDP growth are all telling a synchronous tale of a Goldilocks economy – warm enough with steady economic growth to prevent a recession; however, growth is not so hot as to cause inflationary pressures and force additional Fed rate hikes.  Is it possible the Fed porridge gets too cold, and a recession is inevitable or too hot and the Fed has to institute further rate hikes to cool its stew?

4. Is the U.S. Dollar Set To Rise?

The US Dollar Index has held relatively steady since the end of 2022 and currently sits at 104.20. Despite a small dip to 100 in July, the dollar continues to reflect the strength, resilience, and reliability of the U.S. economy. The U.S. economy’s resilient performance, coupled with the US Dollar Index holding its ground, underscores the Dollar’s status as a safe-haven asset. This is particularly notable in the global context where other major economies like China, Japan, UK and Europe are grappling with more pressing economic challenges such as recessionary conditions (China, Europe) and persistent inflation (Japan, UK).  When a formerly synchronous global economy moves into economic and geopolitical disharmony, does the world’s reserve currency rise in value.

Source: MarketWatch

5. Will Consumers Keep Spending?

According to the latest data, consumer spending growth has risen 4.9% in 2023 following a 9% increase in 2022. This is likely attributed to rising wages and the largesse of COVID-era government spending programs. As these government programs are phased out, particularly the moratorium on student loan debt repayments, more and more people are taking on unnecessary debts and overspending, especially with very high interest rate credit cards. People are making luxury purchases, spending money on traveling, purchasing new cars and clothes, etc. In September of 2023, the total amount of U.S. credit card debt broke $1 trillion for the first time in history. This immense growth in consumer debt raises alarms about financial stability on both individual and systemic levels. More and more consumers will potentially face immense financial strain if the employment picture softens considerably or if illness impacts a household breadwinner. With Black Friday and Cyber Monday here, we’re about to see firsthand whether consumers will keep spending.

6. Perpetual Labor Shortages?

The labor shortage challenges identified last year persist into the current economic landscape. Industries across the board are struggling to find enough skilled workers to meet their business demands. This mismatch between demand and supply can stall economic growth, decrease productivity, and delay production and services. The worker shortage persists in all industries except for goods manufacturing, retail, construction, and transportation. There are currently 9.6 million job openings in the U.S. with only 6.1 million unemployed persons. Even if every unemployed person were to become employed, there would still be an insufficient workforce to meet the demands of employers. This is especially true for the financial services industry where only 42% of the existing job vacancies would be filled if all experienced and qualified professionals (in finance) joined the workforce. The shortage remains a critical problem for many industries and finding an effective solution is proving to be extremely challenging. Have we entered an era of perpetual labor shortages? If so, what does the mean for the inflation picture?

7. Is the Russian-Ukrainian War Really Ending?

The two-year old conflict between Russia and Ukraine, currently deemed a stalemate, has prompted the U.S. and its allies to signal the necessity of negotiating a peace deal. The prolonged nature of the conflict has decimated Ukraine’s national resources, particularly its military personnel, with reports indicating a disastrous shortage of soldiers. The U.S. Department of Defense’s (DOD) recent announcement on November 3, 2023, reveals an increased commitment to supporting Ukraine with equipment, but who will operate them? The DOD is supplying Ukraine with additional military vehicles and gear, $125 million for immediate battlefield needs, and $300 million through the Ukraine Security Assistance Initiative (USAI) to enhance Ukraine’s air defenses. This brings the total U.S. financial support for Ukraine to a staggering $44.8 billion which highlights a sustained and costly effort to support Ukraine’s defense against Russian aggression.

Sadly, new evidence is emerging that a peace deal was achievable at the beginning of the war. At a recent meeting with the African delegation, Putin showed the draft of an outline of a preliminary agreement signed by the Ukrainian delegation at Istanbul in April 2022. The peace deal provided for Russia to pull back to pre-war lines if Ukraine would agree not to join NATO (but Ukraine could receive security guarantees from the West).

Recently, there have been notable shifts in the pricing of key natural resources, such as softening in oil, gas, and agricultural commodities. This signals a potential easing of tensions and the removal of the market risk premium as the end of the war may be in sight.  But if the same foolhardy political leadership prevails that rejected the potential peace deal in the early stages of Russia’s “police action” in Ukraine, how can we be fully confident the Russia-Ukraine war is really ending?

8. Will Energy Disinflation Continue?

Surprisingly, natural gas prices for home utilities have decreased by 20.8% since 2022. Gasoline prices at the pump have also declined with the average price per gallon dropping to $3.41 from $3.95 in December 2022. Gas prices are primarily dropping due to lower demand from drivers (less overall driving) and cheaper blends of gas (lower production costs mean lower costs at the pump).  In the context of the U.S. economy, declining gas prices may signal a period of lower economic activity or a slowdown. Gas prices are expected to drop even more throughout the winter and into 2024 ahead of the summer driving season. This disinflationary pulse in consumer energy prices signifies ongoing adjustments in the supply-demand equilibrium and could have broader implications for consumers’ standards of living.  A key question for consumers in 2024 is will this energy disinflationary trend continue and offset inflation pressures on household budgets elsewhere.

9. Are Bitcoin and Other Blockchain-based Businesses Institutionally Investable?

On November 2, 2023, FTX founder Sam Bankman-Fried, once a billionaire and a prominent figure in the worlds of crypto and politics, was convicted of one of the largest financial frauds in history. A Manhattan federal court jury found him guilty on all seven counts affirming that he had stolen $8 billion from users of his now-bankrupt cryptocurrency exchange. This verdict comes almost a year after FTX filed for bankruptcy which wiped out Bankman-Fried’s $26 billion net worth. This conviction is a substantial win for the U.S. Justice Department with Bankman-Fried facing a potential maximum sentence of 110 years.

With the start of the FTX case, the price of all cryptocurrencies experienced a significant downturn due to shaken confidence in the crypto market and its many charismatic, entrepreneurial founders. However, proven, transparent blockchain-based business models are starting to rebound with Bitcoin emerging as a top-performing asset class for 2023.   Year-to-date through November 17, 2023, bitcoin had gained 67% compared to gains of 26% for midstream energy (Alerian MLP Index), the second-best asset class, and 19% for the S&P 500, third-best asset class.

U.S. regulators at the Securities and Exchange Commission (SEC) have awoken from their slumber and are now taking a more proactive regulatory stance.  After seemingly being asleep at the wheel, the SEC has been taking highly visible actions against bad actors like Sam Bankman-Fried and the CEO and founder of Binance, Changpeng Zhao. Zhao has recently stepped down from Binance after pleading guilty to violating U.S. anti-money-laundering legislation. He faces a $50 million fine and a potential prison term. In addition, Binance has agreed to pay a $4.3 billion settlement. Bankman-Fried and Zhao’s cases are part of a broader crackdown on crypto-related financial crimes and display the increased regulatory enforcement actions in the digital asset industry.

Proactive regulation and legislative clarity are welcomed by many of the leading crypto players like Coinbase, the largest U.S. cryptocurrency exchange platform, and Grayscale Investments, the world’s largest crypto asset manage based on assets under management and the sponsor of Grayscale Bitcoin Trust (GBTC).  The expectation of increased legislative and regulatory clarity from Congress, the SEC, and the Commodities Futures Trading Commission (CFTC) in the near future has encouraged several brand-name, highly credible institutions, like BlackRock and Fidelity, to step into the digital asset space.  The CFTC has determined that bitcoin is a commodity and the SEC and IRS have not publicly challenged that determination. We believe that legislative and regulatory actions in 2024 may emphatically answer the question, “Are bitcoin and other blockchain-base businesses institutionally investable?”

10. Will Student Loans Be Forgiven?

After the U.S. Supreme Court in June struck down his unilateral attempt to “forgive” at least $400 billion in student loans, President Biden has diligently sought  a work-around to this reprimand from the highest court in the land. In October 2023, roughly 3.6 million Americans received a nice Christmas present from President Biden with potentially $127 billion of their student loan debt being forgiven. President Biden announced the plan earlier this year which brought joy and relief for some students and criticism and scrutiny from many other students and taxpayers(some of whom had already paid off their student loan debts). By alleviating a substantial portion of student debt, the plan aims to ease the financial burden on millions of Americans, providing them with increased financial flexibility and potentially curry their favor in the 2024 Presidential election. Based on annual income, students may qualify for student loan relief of up to $20,000.


The move has sparked considerable debate, drawing attention to questions of fiscal responsibility and the long-term impact on the country’s financial health and inflation rates. This also begs the question of where the money for this forgiveness will come from as the US government already faces $33.7 trillion of debt. The current iteration of student loan forgiveness rests on the Biden Education Department’s claims it has the authority to expand income-driven repayment under the Higher Education Act.  This directive is subject to Congressional legislative oversight and/or Supreme Court challenge and begs the question, “Will Students Loans Be Forgiven?”

11. Will Farmland Continue To Be the Star Of the Show?

Farmland stole the mic the last few years as an emerging institutional asset class. Its low volatility and historical negative correlation with traditional assets and positive correlation with inflation had investors lining up to find their slice of farmland heaven. As a result of the increased interest, strong commodity prices, and global food demand, the value of farmland rose throughout the United States 15-25% in just a two-year period from 2020 to 2022. However, that growth had some wondering if it would continue through 2023. In August 2023 the USDA reported farmland valued appreciated 8.1% from 2022 to 2023 but we are starting to see some signs that transactions may slow in the new year. Growing input prices made planting commodities more expensive while commodity prices have declined from peaks in 2021 and 2022. While net farm income is projected to back off from a peak in 2022, it is still projected to remain modestly above the 20-year averages for net farm income and net cash farm income. Even if U.S. farmland leaves the podium as one of the top performing asset classes in 2024, it will always have a seat at the table because of U.S. agriculture’s vital role in making sure the 8.1 billion mouths across the world are fed.

12. How Should a Diversified Portfolio Change?

At Servant Financial, our role is to help you plot the course in these uncertain times. We understand that recent inflationary trends, costly patterns of increased geopolitical conflict, and increased economic and market volatility may cause investor unease.   The basic investment principle of portfolio diversification has more often than not proven its character in the past and we expect it will continue to do so in the future.  That’s why we are asking the questions now on behalf of our clients so we can continuously assess the risk-reward opportunity set now available.  Last month’s featured article, “Got Gold?” established our foundational thinking that the traditional 60/40 (equities and bonds) portfolio allocation will struggle in an era characterized by economic uncertainties, inflation, and geopolitical unrest.  Our task in the ensuing weeks and months is to live these foregoing twelve questions towards some range of likely outcomes and a capstone result that answers the question, “how should a diversified portfolio change?”


Hike Spike: Navigating REIT Sector Amidst Soaring Interest Rates

Introduction

Since March of 2022, the Federal Reserve has lifted its benchmark interest rate 11 times and held rates steady only twice at its regularly scheduled meetings, including this past September’s pause.  With the Federal Reserve’s interest rate hiking campaign seemingly nearing an end at a 22 year high for the Federal Funds Rate of 5.25% to 5.50%, we thought we’d take a fresh look at the Real Estate Investment Trusts (REITs) sector.  REITs have become a more common investment choice for investors looking to diversify their portfolios from traditional 60%/40% stock and bond portfolios. A REIT is a company that owns or operates real estate. The real estate owned ranges widely from office buildings, shopping malls, and hotels to warehouses, data centers, and storage facilities. REITs are attractive to investors because they provide efficient and liquid access to real estate investing without requiring actual ownership or management of real estate properties. REIT companies allow investors to purchase minority interests in their real estate portfolios and essentially hire the executive team and employees to manage the properties on their behalf. REIT investors typically receive consistent and strong dividend payments, share price appreciation, tax benefits, and a hedge against inflation. REITs can avoid double taxation through dividend-paid deductions. REIT companies are required to distribute at least 90% of their taxable income to shareholders through dividends for the REIT to avoid corporate-level taxation. This structure allows investors to receive real estate income without the burden of double taxation.  In other words, REIT investors should receive higher dividend distributions than under a corporate-level taxation regime.


Types of REITs

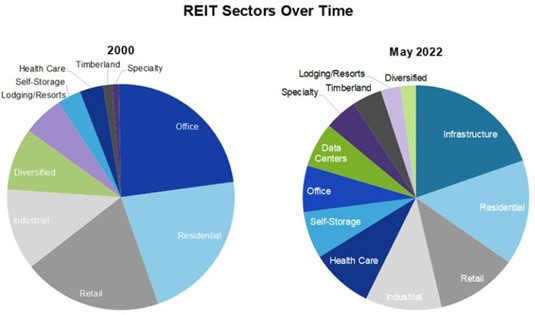
REITs come in various types and specialize in many different types of properties. According to NAREIT data, the predominant categories of REITs today include Infrastructure and Industrial, Residential, Retail, Healthcare, and Office.

The chart below summarizes the comparative REIT components from 2000 and May of last year and highlights the changes in the largest real estate asset classes over time:

Source: National Association of Real Estate Investment Trusts (NAREIT)


Infrastructure and Industrial:  Infrastructure REITs own and manage infrastructure real estate and collect rent from tenants that occupy that real estate. Infrastructure REITs’ property types include fiber cables, wireless infrastructure, telecommunications towers, and energy pipelines.  Industrial REITs own and manage industrial facilities and rent space in those properties to tenants. Some industrial REITs focus on specific types of properties, such as warehouses and distribution centers. Industrial REITs play an important part in e-commerce and are helping to meet the rapid delivery demand.  We’ve grouped these together since one type is essential a network for transferring information while the other is a network for transferring goods.  These REIT sectors are a growing part of today’s modern economy.

Residential: Residential REITs or Multifamily REITs invest in manufactured housing and apartment buildings. They both offer affordable alternatives to home ownership which satisfies a seemingly never-ending demand for younger Americans just entering the workforce.  Affordable housing is another non-discretionary item and there will always be a base level of demand. Residential REITs succeed the most when they invest in areas where home costs are too expensive or impractical and centrally located apartments are in high demand. Cities such as Chicago and New York are prime residential REIT investment examples. If there is consistent demand for apartments over homeownership, Residential REITs will find success.

Retail: Retail REITs invest in shopping malls, strip malls, and other retail outlets. Revenue is received from monthly rent payments from retail tenants.  This leasing aspect makes it important for Retail REITs to try and pick optimal store tenant mix and locations that maximize the amount of foot traffic to their retail properties. Amazon is making it increasingly difficult for most traditional retail department stores to remain profitable and in business.  Think of Sears and K-mart.  Retail REITs need to invest wisely in properties and tenants that are less impacted by online shopping. This includes high-traffic areas such as urban malls, popular tourist shopping areas, and necessity-based or non-discretionary stores for frequent recurring purchases (convenience stores, pharmacies, grocery stores, etc.). Areas that REIT companies tend to shy away from are areas with high vacancy rates, lack of accessibility either pedestrian or car traffic, and areas of economic decline and high crime rates.  For example, Target made headlines this past week with their announcement to close nine stores across four states because of theft and crime.  The Minneapolis-based company will close locations in the Harlem neighborhood of New York City, Seattle, Portland and the San Francisco Bay Area effective Oct. 21.

Healthcare: Healthcare REITs invest in hospitals, clinics, retirement homes, and skilled nursing facilities. Again, given favorable U.S. demographics, particularly an aging Baby-Boomer generation, there is going to be consistent demand for healthcare services which brings stability and success for Healthcare REITs that own the real estate assets leased to retirement home and skilled nursing providers. Increased demand for healthcare, such as with the COVID-19 pandemic, may lead to better performance for Healthcare REITs with variable rent components based on sales. In addition, life expectancies continue to increase which means the older population keeps growing. Since older people require more healthcare and nursing/retirement home services, there is an overall increase in demand for healthcare which has boosted the performance of Healthcare REITs in recent years.

Office: Office REITs invest in office buildings and collect monthly rental income from tenants. These tenants are generally businesses and companies with centrally located offices to drive employee collaboration. As more and more companies are introducing remote work environments, office vacancy rates have increased in recent years which has put significant pressure on the Office REIT sector. Office vacancy rates have climbed across all of the major U.S. cities, led by San Francisco’s increased vacancy rate of nearly 20%.  The Visual Capitalist stated that it is anticipated that by 2030, over 300 million square feet of U.S. office spaces will be obsolete. Other factors such as the unemployment rate and economic performance can also directly affect the performance of Office REITs.


REIT Yields and Comparison to Farmland

REITs have traditionally provided investors with consistent dividend income and appreciation potential. The amount and variability of rental income depends on the type of REIT and the overall sector performance at the given time.  We’ve tried to highlight the differences in REIT income sources above between those that a predominantly non-discretionary in nature like Residential REITs and those REITs with higher variability in rental streams like Office and Retail REITs.

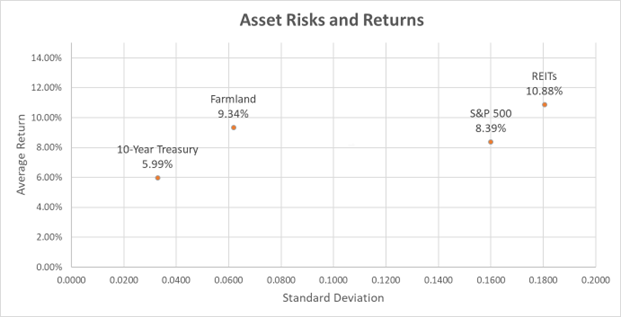
Using data compiled from the TIAA Center for Farmland Research, we’ve compiled performance data below for REITs, farmland, 10-year U.S. treasury, and the S&P 500 for the last nearly 50-year period (since 1975).  REITs (averaged from all types) average annual total return of 10.88% per year while farmland provided an average annual return of 9.34% nationally. While REITs offered the highest annualized return over this period, it was also the most volatile of the four assets as measured by the standard deviation of its returns at 18%.  REIT volatility surpassed the S&P 500 of 16%.  Farmland outperformed all of the other asset classes on a risk-adjusted basis with its annual return of 9.34% but with only a third of the volatility of REITs at 6%.

The performance of most REIT sectors are more variable than farmland depending on economic factors such as interest rate fluctuations and supply and demand changes. REITs are considered an interest rate sensitive asset class much like the utility sector. For example, the largest REIT ETF is Vanguard REIT Index (VNQ). VNQ’s year-to-date returns through August 2023 are measly 1.9% total return with a one-year annualized loss of -7.3% and two-year loss of -9.7%. On the other hand, farmland has generally continued to appreciate in 2022 and 2023 based on the favorable trends in farming income. Farmland stability comes from the constant need for food and the fact that it’s uncorrelated with other asset classes, but highly correlated with inflation as measured by the Consumer Price Index (CPI).

Source: https://farmland.illinois.edu/research-briefs/


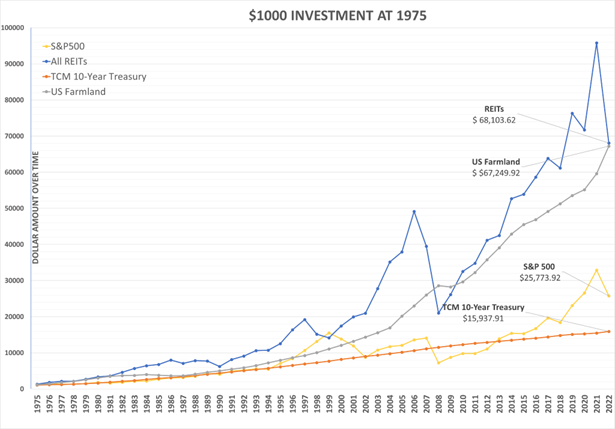
As the chart depict below, REITs have still given farmland a run for their money albeit with more volatility producing a value of $68k for $1k investment in 1975.  Farmland was a close second at $67k outcome for your $1k. However, the stability of farmland returns is noticeable from the chart.  Farmland generates income from agricultural activities which have relatively lower capital expenditures and income potential compared to income-generating properties like multifamily apartments or commercial office buildings. REITs will have much more capital expenditures for repair and maintenance of building structures whereas farms are mostly land with farm structures generally approximating 5% to 10% of the value of the farmland. Investors generally require higher yields from REITs because of the higher Capex requirements and the higher risk of obsolescence.  Think Office REITs and some Retail locations and business models. In theory, investors should therefor require a lower risk premium for farmland given its lower volatility as compared to REITs, but there is limited available data to support this assertion.

This graph shows the growth of a $1000 investment in 1975 over time. If you invested $1000 into each of these 4 asset classes, you would get the most return out of REITs and farmland.

Source: https://farmland.illinois.edu/research-briefs/


The State of REITs

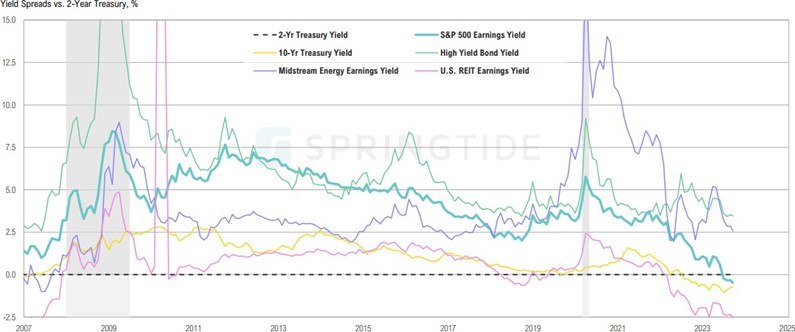
Servant Financial’s institutional investment research partner SpringTide Partners recently conducted a review of state of interest rate sensitive real estate sector considering the Fed’s hike spike in interest rates.  SpringTide examined REITs, midstream energy, and S&P 500 earnings yields (E/P, or cap rate) to 2-year and 10-year U.S. Treasury yields.  Below is a chart of the spread between these earnings yields and the 2-year treasuries.    You’ll note that for REITs the current yield spread is roughly -2.5%. This spread to 2-years hasn’t been this negative previously until just prior to the 2008-9 global recessionary period and the Global Financial Crisis. In that era of Fed policy mismanagement, REITs yield spreads blew out almost 7.5 percentage points from -2.5% in 2007 to just shy of 5.0% in 2009.  This graph also demonstrates the yield spread of REITs compared to other asset yields.  You’ll also note that yield spread to 10-year treasuries and S&P 500 is also negative for the first time since 2007.  In other words, investors are not receiving a risk premium over 2-year treasuries for investing in either REITs, long-term treasuries (no term premium), and S&P 500.   This analysis suggests investors would currently be better off putting money into a savings account rather than REITs, 10-year treasuries, or the S&P 500.

Source: https://springtide-partners.com/


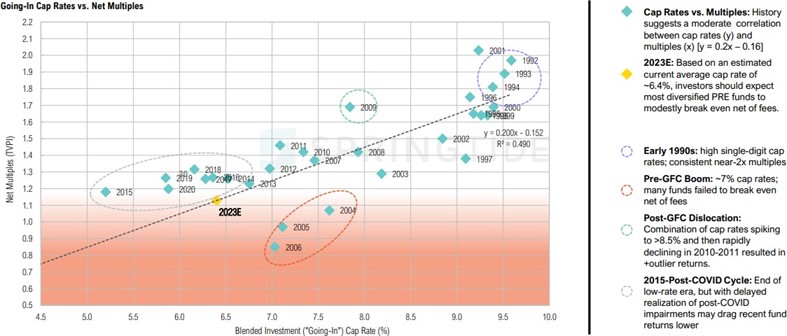
This chart below demonstrates that the historical entry/purchase cap rates for REITs are a key determinant of an investor’s exit net multiples. The cap rate is computed as the net operating income of a REIT divided by the purchase price at time of entry. Higher cap rates suggest higher risk at the time of purchase and increased risk premiums relative to risk-free treasuries. REITs today are trading at 6.4% cap rate, or earnings yield.  According to this chart, investors who buy REITs at the current 6.4% cap rate would be lucky to break even much like where the 2015-post-COVID cycle investors who bought in.  Alternatively, the historical sweet spot to invest in REITs was in the early 1990s and the pre- and post-Dot.com bust of the late 1990s and early 2000s when entry cap rates were roughly 9.5% compared to today’s 6.4%.


Source: https://springtide-partners.com/


Conclusion

REITs have gained popularity amongst investors for their portfolio diversification benefits. They offer exposure to a range of real estate sectors and risk profiles, such as retail, residential, healthcare, office, and infrastructure/industrial. While REITs have provided historically attractive average annual returns since 1975, other investment options, such as short-term U.S. treasuries, money market funds, farmland, or high-yield bonds, look more attractive on a risk-adjusted basis in our current economic state. High-interest rates are drastically affecting the performance of REITs, particularly those REITs with higher leverage, interest rate risk, and near-term refinancing exposures. Our recommendation is that REIT investors remain patient and await the Fed’s “hike spike” to work its way into REIT entry cap rates.  Based upon recent history, a move in REIT yield spreas over 2-year treasuries of 2.5% to 5.0% seems “real”-istic.

Twelve Themes of Christmas

Contributions made by: John Heneghan & Michael Zhao


‘Twas the week before Christmas, when all through the financial house, not an investor was resting, not even a DC louse. 2022 brought investors increased market volatility and a wide array of risks and uncertainties remain, yet some opportunities may lie hidden under the Christmas tree. From inflation worries to geopolitical risks, we have been on a wild sleigh ride this past year. But whether you landed on the naughty or nice list this year depended on your ability to navigate the economic whiteouts caused by the likes of the Federal Reserve, Vladimir Putin, and Sam Bankman-Fried.


Tis’ the Season for Interest Rate Hikes

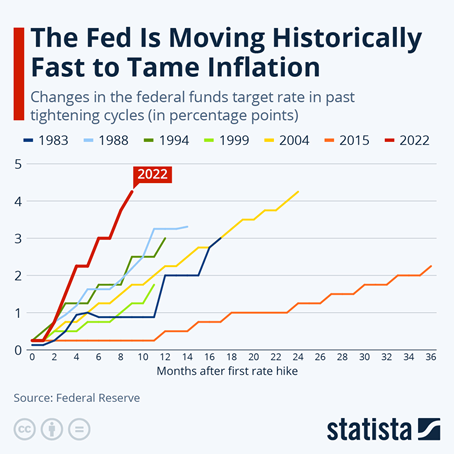
On the first day of Christmas, Federal Reserve Chairman stuffed my stocking with 7 rapid interest rate hikes. The Fed has been hiking the benchmark Federal Funds Rate at an unprecedented pace to combat high inflation which is causing concern among investors and consumers alike. As the cost of borrowing increases, whether it’s for a mortgage, car loan, or credit card, it impacts the affordability of goods and services for many households.  People tend to hunker down on spending and are less likely to take on new debt, which impacts aggregate consumer spending and business investment. Recently, the Federal Reserve raised its benchmark interest rate from 4.25% to 4.5% in its final policy meeting of the year. This marks the seventh consecutive increase in just nine months to the highest benchmark interest rate in 15 years.

The Federal Reserve has signaled its desire to keep interest rates higher through 2023 with the potential of rate easing, not until 2024. As a result of the Fed interest rate hikes, mortgage rates have reached 20-year highs, interest rates for home equity lines of credit are at 14-year highs, and car loan rates are at 11-year highs. Savers, on the other hand, are seeing the best bank deposit and bond yields since 2008. The 10-year U.S. Treasury yield hit a 12-year high in September at 3.93% causing foreign investment to flock to U.S. treasuries and spurring strength in the U.S. Dollar. After several years of low-yielding bond investments, investors are busily re-balancing their investment portfolios so they can much more safely jingle their way to their investment objectives.

Source: Statista


Dashing through Inflation

Santa’s pocketbook may be feeling a bit squeezed this gift-giving season as inflation continues to rage at the North Pole, particularly for the basic foodstuffs like milk and cookies. The Bureau of Labor Statistics reported earlier this month that the U.S. Consumer Price Index (CPI) saw a 7.1% increase year over year during the month of November, down from annual CPI of 7.7% in October and lower than the 7.3% increase forecast by economists. Importantly, the November monthly increase slowed to 0.1% and was driven into positive territory primarily by rising food (0.5%) and housing costs (0.6%). The PCE Prices Index due this Friday is the last consequential data release for the year. Other data this week mostly focuses on the housing market where home sales have slowed down, but actual prices continue to rise. Still rising housing costs are a problem for the Federal Reserve as “shelter” expenses account for the largest share of CPI. Housing cost increases have been slowing down and many economists believe gauges for both home prices and rents will start to show declines in the coming months.  The Fed’s owner’s equivalent rent measurement is a notorious lagging factor and when this statistic rolls over it may take a substantial bite out of headline inflation.  Supply chain backlogs, rising costs, government spending, labor shortages, and increasing demand have all played a part in elevating inflation to its current levels. As a result, these inflation trends have been the principal driver of the Federal Reserve’s aggressive hiking policy which has economists, investors, and consumers appropriately worried that a Fed-induced recessionary winter storm might be brewing as the Fed overshoots on the hawkish side.


Baby, it’s Looking like a Recession

Current economic pressure really can’t stay, baby, it’s looking like a recession. Recession fears are rising as investors lose confidence in U.S. economic performance in the face of an unprecedentedly rapid and yet unfinished Fed hiking cycle. Despite relatively strong economic growth in the third quarter of 2022 and a still low unemployment rate of 3.7%, the Federal Reserve has lowered its forecast for next year’s U.S. economic growth in light of its rate hikes and expects the unemployment rate to rise by the end of 2023 as well. Some believe that the current widespread concerns about a recession may help us avoid one, as caution leads to less risk-taking and borrowing, potentially cooling the economy enough to reduce inflation and the need for further interest rate hikes. Lagging inflation statistics remain elevated and central banks globally are continuing to raise interest rates to destroy demand and slow economic growth in the coming year. More real-time inflation measures, like the Cleveland Fed’s “Inflation Nowcasting” measure, show inflation moderating. Inflation Nowcasting’s fourth quarter run-rate CPI is at 3.5% and Core CPI (excluding food and energy) is at 4.7% suggesting the Fed is “fighting the last war” rather than anticipating what will happen next.


The U.S. Dollar All the Way

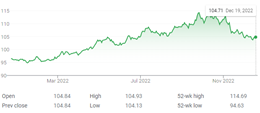
Santa’s reindeer are taking a new launch angle this year along with the U.S. dollar by soaring to new heights in 2022. The US Dollar Index, a measure of the dollar against a basket of other major global currencies, had been on the rise throughout 2022 but started to taper off in late November and December. Other central banks have joined the competitive rate-hiking game and compressed interest rate differentials. The strong dollar is beneficial for American consumers who purchase foreign goods, as it makes them cheaper in U.S. dollar terms. However, it can be an earnings headwind for American businesses that export goods or have multinational business operations such as McDonald’s and Apple. McDonald’s reported that its global revenue fell 3% this past summer due to the strong dollar as the rising costs of Big Macs have foreign consumers turning to other options. The strong dollar is also a reflection of the relative strength of the U.S. economy compared to other advanced economies, such as those in Europe (Euro) and Japan (Yen). Foreign investors flocking to higher and arguably lower-risk U.S. treasury yields only bolsters the dollar further.

U.S. Dollar Index; Source: Google Finance

Eat, Drink, & Spend like Consumers

U.S. consumers found themselves on the nice list in this year of profligate government spending. The US government gave consumers several nice stimulus checks due to the COVID-19 pandemic.  While some consumers used these relief funds to pay for day-to-day necessities, others have been able to enjoy new furniture, electronics, and vacations that have them saying “Mele Kalikimaka”.  Economists predict this holiday season may be the last fling of spending toward luxury brands and exotic travel. The current level of consumer spending is projected to dwindle towards the end of next year as recessionary fears manifest and unemployment levels grow as the Fed’s aggressive hiking policy takes hold.


It’s Beginning to Look a lot like a Labor Shortage

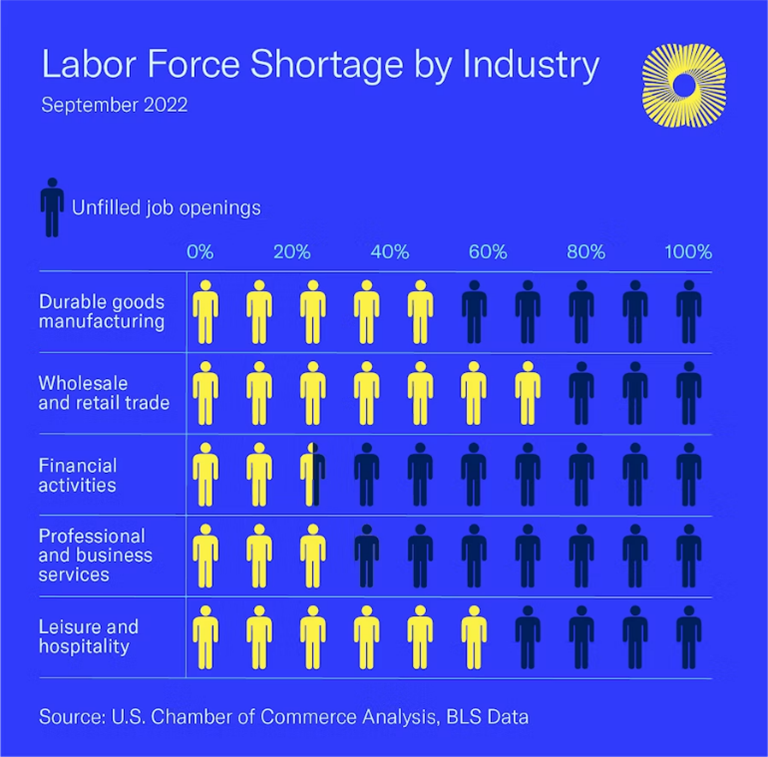
Santa may be having a bit of trouble finding enough elves to manufacture toys in his workshop this year. The COVID-19 pandemic brought about many changes to people’s lifestyles, and many re-evaluated their lifestyles as they were challenged with their mortality. Across the nation businesses in every sector are feeling the pressure to find enough skilled labor to meet the growing consumer demand for goods and services. In 2021, 47 million workers quit their jobs in what is referred to as the “Great Resignation.” The industries hurting the most are food services, manufacturing, & hospitality. Workers have signaled a desire for better company culture, work-life balance, and compensation. Some believe the labor shortage will work itself out if a recession were to occur.   However, others argue that this is just the beginning of secular labor shortages as declining birth rates in the U.S. and other developed nations have economists worried that we are not restocking the world’s workforce fast enough. Maybe Santa will be nice enough to supply us with some of his highly productive elves to bridge this gap until intelligent robotics develop further.

Source: US Chamber of Commerce


How Vladimir Putin Stole Ukraine

At the top of most of the world’s Christmas wish list is for the Russian-Ukrainian conflict to be resolved. Not only did the invasion of Ukraine in February bring about economic disruption but it has brought devastation to the Ukrainian and Russian people. It is estimated that close to 7,000 civilians in Ukraine have lost their lives in the conflict. The power-hungry, Russian Grinch Putin, is committed to overtaking Ukraine for strategic access to important trade routes and resources. Currently, Russia is occupying several major port areas along the Black Sea.  The Ukrainian defense has been putting up a strong fight with the help of $32 billion and growing of financial support from U.S. taxpayers.  Several trade restrictions and sanctions have been put into place to hurt Russia financially.  However, since Russia is the global largest energy supplier of natural gas and oil, these sanctions are only putting more extreme pressure on energy prices worldwide. Ukraine is also a large exporter of agricultural products, and the conflict has caused several production and logistics issues for Ukrainian farmers. Commodity prices have climbed as a result, particularly for wheat. While the conflict today looks unresolvable, maybe Grinch Putin’s heart will grow three sizes and he’ll decide to shower Who-ville with presents instead of artillery.  “Fahoo fores dahoo dores!”

Photo Source: Behance

Source: Wikipedia


Making Energy Bills Bright

As the war between Russia and Ukraine rages on, energy bills for people around the world continue to climb. Oil and natural gas prices have soared in 2022 with Europe being hit hardest by the jump given its deep dependence on Russian natural gas. In August, gas futures hit a record high of 350 euros creating immense pressure for European nations to set price limits on natural gas. Household electricity prices from natural gas-fired plants have increased in Europe by 67% in just one year, stopping some Europeans from lighting their Christmas trees this year. The European energy ministers imposed an electricity price cap this week to help lessen the burden on consumers. The United States has also felt the brunt of high energy prices as power prices rose almost 16%, the highest increase in 41 years. Consumers also felt the pressure at the gas pump as the average price of a gallon of gas rose to $4.96. Maybe in 2023, we can be like Santa and his reindeer-powered business model by running more of our economy on renewable energy.


Cryptocurrencies Roasting on an Open Fire

Cryptocurrencies roasting on an open fire, Sam Bankman-Fried nipping at your confidence. One of the largest cryptocurrency exchanges and hedge funds, FTX, filed for bankruptcy this November after information was released about its risky holdings and clandestine relationship with its affiliated hedge fund Alameda Research spooked many of its exchange customers. Several exchange customers sought to withdraw their crypto holdings from the FTX exchange, prompting the bankruptcy filing of the company.  It turns out FTX was another Ponzi scheme or con game with apparently none of FTX’s well-healed venture capital investors doing any due diligence or demanding a role in corporate governance. The price of Bitcoin has fallen 65% in the past year with investors losing confidence in an asset class imputatively regulated by the SEC and Commodities Futures Trading Commission (CFTC).  The CFTC has defined bitcoin as a commodity, but a turf war has continued with SEC creating regulatory uncertainty and ample opportunities for miscreants.  FTX was a Bermuda-based firm regulated by the Securities Commission of the Bahamas.  The SEC could have required crypto exchange registration and reporting and U.S. domestic incorporation.   Former FTX CEO, Sam Bankman-Fried, has agreed to extradition and will now be answering to the Justice Department and SEC for violations of wire fraud, money laundering, securities fraud, commodities fraud, and conspiracy to violate campaign finance laws. The once shiny wrapped package that was FTX Digital Markets now looks like a lump of coal.  Expect the naming rights for FTX Arena, home of the Miami Heat, to become available soon and most of FTX’s liberal political contributions to be returned to the bankruptcy court. Bernie Madoff will look like a petty thief compared to SBF.


Dreaming of Student Loan Forgiveness

About 43 million Americans received a nice Christmas present from President Biden this year, with forgiveness for part of their $1.6 trillion student loan debt. President Biden announced the plan earlier this year sparking both joy for recipients and scrutiny from every other U.S. citizen. The plan would eliminate $10,000 in federal loans for individual borrowers making less than $125,000 per year or couples earning less than $250,000 annually. Pell Grant recipients, which account for 60% of current student debt holders, could receive upwards of $20,000 in forgiveness. However, this largesse begs the question of where the money for this forgiveness will come from as the US government already is $31 trillion in debt.  Biden’s Executive Order faces many legal challenges in Congress and the Supreme Court to overcome and move this profligate effort forward.


All I Want for Christmas is Farmland

The bright star on top of the investment tree this year is an asset class that has been at the top of many institutional investors’ Christmas wish lists all year, U.S. farmland. Farmland hasn’t always been seen as an accessible investment option.  However, farmland funds such as Promised Land Opportunity Zone Fund and others have been formed to allow investors access to in this durable, inflation-beneficiary asset class. Iowa State University recently reported farmland values in Iowa were up 17% in 2022 which comes on top of a 29% increase in 2021. Similar stories have been reported throughout the Midwest as strong commodity prices fuel farm incomes and transacted land values. The COVID-19 pandemic had people re-evaluating what is important to our world with basic human needs, like food, at the top of the list. While consumer preferences and social trends may change, people will still need to eat, making farmland one of the most durable asset classes through time. This has many investors saying “All I Want for Christmas is Farmland.”


We Wish You a Diversified Portfolio

At Servant Financial, our goal is to help you navigate these turbulent times and help you make the best decisions for your investment portfolio. We understand increased market volatility may be causing investor unease, but it is times like these that the basic investment principle of portfolio diversification proves its mettle.  With inflation still a concern and US treasuries on the rise, we are paying close attention to iShares 0–5-year TIPS Bond ETF, STIP. With low management fees (.03%) and a 30-day SEC yield of 5.84%, its 2.5-year duration could be an ideal addition to a blended debt and equity portfolio.  The principal value of TIPS (upon which the stated interest is paid) is adjusted semiannually as inflation rises, as measured by CPI.  STIP holds a variety of U.S. treasuries with maturities of less than 5 years protecting you against rising interest rates and inflation.  STIP is a core holding of Servant’s risk-based client portfolios.


Happy Holiday’s from your friends at Servant Financial and we wish you a globally diversified portfolio.  

Instead of holiday cards or gifts, Servant Financial will be making an annual contribution on behalf of clients and friends to Mercy Home for Boys & Girls.

May this holiday season be a time of rich blessings for you and your family.

Source: Pinterest

Going, Going, Gone! Is Inflation Running Away with our Money and our Investment Returns?

On the field that is the U.S. economy, currently loading the bases are looming interest rate hikes, the value of the U.S. dollar, and rising Treasury yields. On the mound, is Federal Reserve Chairman, Jerome Powell, and everyone from investors to consumers are waiting to see what will happen next with monetary policy and the economy. Early in the game, the COVID-19 pandemic threw a curveball, and ever since, the economy has been dribbling a series of weak grounders from persistent unemployment, to supply chain disruptions and a declining labor force participation rate. Will Chairman Powell toe the rubber to strike out runaway inflation and imperil economic growth or is the US economy in for extra innings?

How did inflation get so out of hand?

The U.S. Bureau of Labor Statistics reported that in January 2022, the consumer price index rose 7.5% from January 2021, the highest rate of inflation since February of 1982. Some of the industries seeing the largest price hikes are the energy, gasoline, housing, and food sectors which is of no surprise for anyone who has bought groceries or visited the gas pump lately. Even with the rise in prices, it hasn’t generally stopped consumers from spending. The Commerce Department reported that retail sales are up 3.8% year over year with large gains reported in vehicle, furniture, and building supply purchases. Home sales have been on the rise as well with the National Association of Realtors citing that home sales in January were up 6.7% from the previous month. This comes as home buyers are trying to secure financing at lower interest rates before the anticipated Federal Reserve rate increase next month.

Source: SpringTide US. Inflation Trends

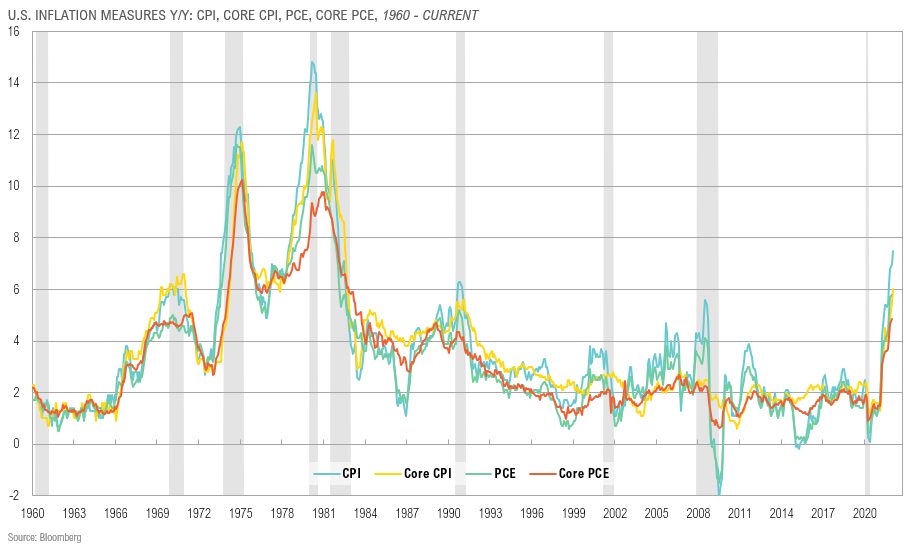
While this level of inflation is unlike anything Americans born after the 1970s and early ‘80s have ever experienced, many economists are not surprised by this spike in the CPI. The federal government has shelled out more than $3.5 trillion in COVID-19 relief funding in the form of stimulus checks, unemployment compensation, and the paycheck protection program. The figure below shows the allocation of this spending with more spending earmarked through 2030 as the government continues to combat the aftershocks of the pandemic. The excess liquidity in the market, combined with the supply chain disruptions and labor shortages, has created the perfect cocktail for inflation to brew. While this spending was necessary to keep the economy out of a recession, some argue the federal reserve hasn’t been aggressive enough in unwinding its pandemic era policies to combat rising inflation. The Federal Reserve has announced that rates will start to rise in March, but by how much? Experts, such as economists at Citibank, are predicting anywhere from a 25 to 50-basis point hike with the later end of the spectrum becoming more likely as inflation rises. They are then expecting three to four more 25-basis point hikes by the end of 2022. Economists feel this could help slow inflation by the end of the year, but supply chain disruptions and incipient wage inflation risk still loom.

Source: CNBC analysis of Treasury data compiled by the Pandemic Response Accountability Committee

Is 2022, the new 1980?

The survivors of the last battle with inflation in the 1970s and 80s know all too well what runaway inflation looks like.  It has some questioning whether we are in for a blast from the past in 2022. Inflation peaked in 1980 at 14.8% and while we haven’t hit those levels yet, the jump we have experienced has people on their toes for a line drive heading for them. Inflation in the ’80s was driven by a variety of factors from unpredictability in interest rates to soaring oil prices. Most economists believe that this time is different than the 1980s as recent inflation has been caused by COVID-19 aftershocks of excess liquidity and supply chain issues. These factors are expected to normalize over time.

Examining our Investment Strategy

Markets have been off to a shaky start in 2022 with inflation and geopolitical risks in Russia & Ukraine driving the recent volatility. Economists and investors worry that if war broke out between Ukraine and Russia, it could cause more supply chain disruptions of commodities which could prolong inflation. While the Federal Reserve’s announcement of a March interest rate increase has curbed some concerns about more inflation, these new geopolitical risks could overshadow efforts to reduce inflation through monetary policy. As a result, investors are watching markets closely in addition to exploring inflation-protected physical assets such as gold or farmland. Below is the historical correlation between several asset classes and the consumer price index using returns data from 1970-2020. The CPI has historically had a positive relationship with bonds and precious metals but a negative relationship with equities.

Source: Data supplied by the TIAA Center for Farmland Research

Physical assets such as precious metals and farmland have taken center stage the past few months with gold values up 5.3% year to date and farmland values up 22% in parts of the Midwest since this time last year. While these physical assets have been investors’ go-to during high inflationary periods in the past, investors have also been allocating more of their portfolios to cryptocurrencies as well. Cryptocurrencies have a relatively short history compared to traditional assets which makes it difficult to analyze their performance with inflation, however, some investors are calling it “digital gold.” Even Mr. Wonderful, Kevin O’Leary, claims that his portfolio has more holdings in cryptocurrencies now than gold. Crypto enthusiasts cite its ability to be shielded from the effects of government money printing and spending largesse.

Servant Financial has been keeping tabs on inflation and has updated its investing strategy accordingly based on investors’ risk tolerance. While we are still allocating a portion of portfolios to equities and fixed income instruments, we’ve had a higher portfolio tilt towards allocation to precious metals, real assets, and Grayscale Bitcoin Trust (BTC) as protection for client portfolios from inflation. INFL, Horizon Kinetics Inflation Beneficiaries ETF, has recently been added to the portfolio as well. It is an actively managed ETF designed to capitalize on growing inflation trends. Currently, INFL has $896 million assets under management with holdings in transportation, financial exchanges, energy and food infrastructure, real estate, and mining companies. While INFL has a diverse group of global holdings, its top holdings are in PrairieSky Royalty (Oil & Gas), Archer Daniels Midland (Food & Agribusiness Processing), and Viper Energy Partners (Oil & Minerals).

While inflation has threatened investors’ portfolio returns, an adjustment in investment strategy for the purposes of inflation hedging will help investors score in the performance game in the later innings of this economic cycle. A watchful eye must be kept on key economic signals such as changes in interest rates, inflation trends globally, and the supply chain normalization. If you would like to discuss your asset allocation so you can do well in all facets of the investment game like the alert and observant Willie Mays, the Say Hey Kid (Say who. Say what. Say where. Say hey.), contact Servant Financial today.

Organic Agriculture: Fad or Durable Trend?

Background on Organic Agriculture

Walking down the aisle of the grocery store, a shopper can find a variety of different food labels attempting to win their attention such as “No Added Sugars”, “Gluten-Free”, or “No Artificial Dyes or Flavors.” More recently, labels such as the one below have been popping up in grocery stores across the U.S.

 USDA Organic Seal

It used to be that organic products were only found in select stores that specialized in organic or sustainable food products, but more and more organic products are going mainstream and can be found in big-name grocery stores such as Walmart, Costco, and Target. In fact, Walmart, is the #1 seller of organic products offering more than 400 different organic products. That figure surprises some people that expect traditional specialty stores such as Whole Foods or Trader Joes to dominate the space, but the market share of Walmart outpaces both of these popular organic store chains.

But what actually constitutes a product as organic? While this definition could be different based on who you ask, the Environmental Protection Agency defines “organically grown” as food that is grown and processed without synthetic fertilizers or pesticides. However, natural pesticides that are derived from animals, plants, bacteria, or minerals are allowed. Organic production has been taking place in the United States since the 1940s but it started to gain steam in the 1970s as consumers demanded more environmental awareness and became increasingly concerned about how food was grown. In 1990, Congress passed the Organic Foods Production Act to develop national standards around organic production in both livestock and crop production. The National Organic Program which is a marketing program managed by the USDA aims to create and monitor uniform standards around organically produced products to aid consumers in their decision-making.

Drivers for Organic Products

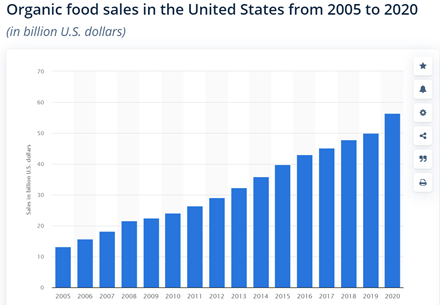
Organic sales currently account for more than 4% of total U.S. Food Sales and that number is projected to continue rising in the future. Total sales of organic products grew 31% from 2016 to 2019 domestically and are projected to grow at a compound annual growth rate of 10% through 2025. The dominant organic product in the U.S. market is fruits and vegetables with large growth in 2020 in the pantry stocking and meat, poultry, and fish sectors.

Organic sales are on the uptick with sales reaching $56 billion in 2020.

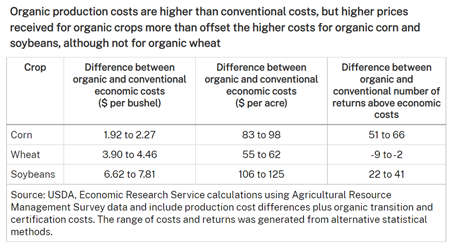
While there are a variety of factors driving organic food demand such as environmental or health concerns, the largest reason is consumer preference and affordability. Historically, organic products cost anywhere from 10-50% more than conventional products. When it comes to one of the U.S. largest agricultural exports, corn, the price of organic corn is more than double its conventional counterpart. Organic production is more costly for producers.  In addition to higher seed and land costs, producers face a costly 3-year transition period in the land to become certified organic. During this time, the land must be “cleansed” of any conventional pesticides or fertilizer. Once a farm is deemed USDA certified organic, the returns are considerably higher than conventional methods for corn and soybeans in particular. The table below from the USDA presents data that shows that although organic production costs are higher than conventional costs, the higher prices received for organic crops more than offsets the higher production costs for corn and soybeans.  The same can also be said for organic meats and produce however there is less widely available information about those markets.

While the costs of organic production are higher, this is offset by higher prices received.

After investigating the returns to organic production, you might ask, why aren’t more farmers producing organic products? The biggest hurdle for farmers is the three year transition period and capital expenditures needed to become organic. The three-year transition can cause a financial hit to producers that can be difficult to recover from. Another difficulty for organic producers is the lack of infrastructure in the organic industry. Unlike, conventional products like corn and soybeans, there is not a centralized market such as an exchange for organic products to be bought and sold. Organic products often require more specialized handling and storage and there are not as many facilities able to handle these needs. While government policy is working to change this, there is much work to be done in this space if the U.S. is to meet its own domestic demand for organic products.

Investment in Organic Agriculture

An investment in organic agriculture could be attractive for investors not only in investment performance but also may fit their preferences to actively support environmental, social, and governance (ESG) standards. Many organic companies share these beliefs and would seek to leverage capital from ESG investors to transform and grow the organic marketplace and infrastructure. Investors looking to capitalize on organic investing have a variety of options. They could invest in the common stock of companies selling organic products such as WhiteWave Food (WWAV) which owns 4.2% of the organic market share with popular brands such as Horizon Organic. In 2017, WhiteWave Food was acquired by Danone, one of the largest multinational food companies.

Another common stock option could be to invest directly in organic grocers such as Sprouts Farmers Market (SFM) which specializes in premium organic foods and performed quite well against large grocery competitors during the COVID-19 pandemic. Sprouts delivers a unique farmers market experience with an open footprint of fresh produce at the heart of the store and welcoming look and community feel.  Sprouts offers an assortment of fresh, high quality food that is sought after by its more affluent and educated consumers. Because they are able to capitalize on health and quality conscience consumer base, their profit margin is 4.5% which is strong compared to one of the largest grocery stores in the U.S., Walmart, who has a profit margin of 1.4%. Sprouts’ ESG operating focus has also impressed its stakeholders, particularly its efforts to reduce food waste by 78,000 tons.  Sprouts has an equity market cap of $3.2 Billion and trades at a reasonable 11 times trailing twelve month earnings.  Sprouts is ramping its growth plans and intends to add 300 – 400 new stores in expansion markets of Texas, Florida, California, and New England.

In last month’s article, we discussed the Promised Land Opportunity Zone Fund which provides investors the opportunity to deploy capital in farmland which has historically provided strong returns with inflation hedging capabilities. The farmland in this fund lies within an opportunity zone, providing tax benefits to investors. The Promised Land Opportunity Zone Fund is looking to deploy capital to organic conversions in opportunity zones as part of its broader opportunity zone investment in farmland. If you are interested in learning more about the Promised Land Opportunity Zone Fund, please contact Ethan Rhee at ethan@servantfinancial.com.

Another option for investment in a private fund that is more of a pure play in the production of organic food, an investor could invest in an organic farmland REIT such as the Vital Farmland REIT LLC (Fund II) managed by Farmland LP. Farmland LP’s has assets under management valued at more than $200 million across its two farmland funds, totaling close to 15,000 acres. Farmland LP earned the highest corporate sustainability rating by HIP Invest Inc. in 2021 for its ESG efforts.

For ETF investors, there are fewer options for direct organic investment however several ETFs are investing in food production and food processing. The First Trust Nasdaq Food & Beverage ETF (FTXG) has $6.4 AUM and also has a AAA rating (best) for ESG impact by Morgan Stanley Capital International. Their primary holdings are in food processors such as Bunge, Tyson, Archer-Daniels-Midland, and General Mills. These companies are all making significant strides towards increasing processing capabilities for organic products.

While organic agriculture has made substantial advances in the past ten years, this emerging agricultural sub-sector is still in need of capital to grow productive capacity and reach its full potential. An investment in organic food production provides for diversity of consumer preferences as well as environmental and sustainable production benefits for American farmers and farming communities. The historical and projected organic sales data and savvy investor capital flows suggest that organic agriculture is a durable trend that is here to stay.

One Up On Main Street – A Farmer’s Daughter’s Guide to Farmland Investing

Author’s Note

“This past month, I defended my master’s thesis on the Role of Farmland in a Mixed Asset Investment Portfolio. Under the direction of Dr. Bruce Sherrick at the University of Illinois at Urbana-Champaign, I explored how an investment in farmland can interact in an investment portfolio of equities, bonds, and treasuries in addition to how it can hedge against inflation. Using data maintained by Dr. Sherrick and courtesy of the TIAA Center for Farmland Research, I analyzed the returns to farmland from 1970-2020 and some of my results are discussed below in addition to introducing farmland as an asset class to institutional and individual investors.” – Ailie

Background on US Farmland

Farmland is a unique asset class in that it has a limited supply and potentially an unlimited useful life. Only 17.2% of the United States landmass is considered arable.  With a growing world population projected to reach 9.7 billion by the year 2050, farmland is well positioned as a production source for a basic human need: food. Not only is the population rising but income levels are also expected to follow suit with world GDP projected to double by 2050. These statistics suggest that demand for food is going to go up and the composition of caloric intake is expected to change. Research shows that protein consumption rises with rising income levels.  With a significant portion of farmland acres dedicated to either feeding livestock or producing other protein sources like chickpeas or lentils, farmland owners and operators are uniquely positioned to meet this demand and profit from it. So long as humanity needs food, there will be economic rewards for the cultivators and landowners.

Farm Balance Sheet

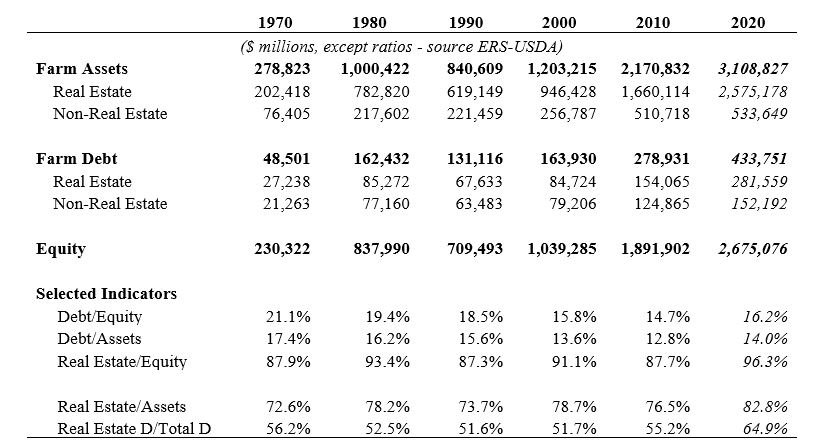
If an institutional or individual investor was investing in a company’s common stock or buying a corporate bond, they would typically examine the balance sheet of the company. The same is true for investing in farmland. Farmland has grown in value significantly over the last 50 years with a 55% increase in the last 10 years alone. Farmland (Real Estate in the table below) dominated the asset side of the farm sector’s balance sheet encompassing close to 83% of total assets. Under the recent low-interest-rate environment, farmland’s debt level has also grown but this is still significantly less than the portion of farm assets it supports. The overall low debt to equity ratio of 16.2% demonstrates a very conservative leverage position relative to other real asset sectors and the relative strength of the U.S. Agriculture industry as a whole.

Data maintained by the TIAA Center for Farmland Research based on data from the Economic Research Service, a sector of the USDA

Returns to Farmland

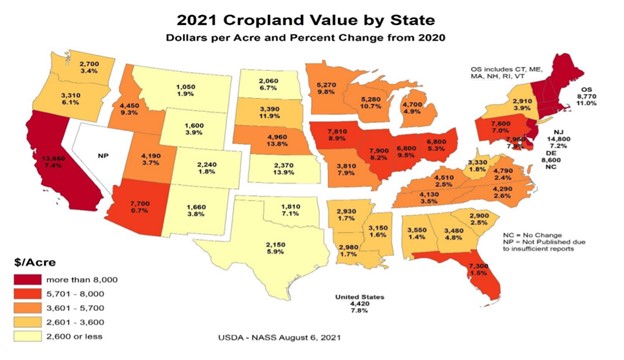
Like any real estate asset, farmland receives returns when held by an investor in two ways: appreciation in value and cash flow generated from rental income. In 2021, the U.S has experienced a rise in both. According to the USDA, farmland prices are up 8% from last year.  Record sales prices of farmland have been occurring throughout the U. S.’s key growing regions.

August 2021 USDA Land Values Summary

On the rental income side, most investors would be participating in a straight cash rent system meaning a farmer pays the landowner a fixed amount per year for the use of the land. Recently, the U.S. has experienced growth in cash rent values along with the rise in farmland prices.  Fueled by strong commodity prices, healthy farming profits, and appreciating land value, cash rental rates are projected to rise 10% in 2022.

To examine a longer-term horizon of historical returns to farmland, data from the TIAA Center for Farmland Research was utilized from the years 1970-2020. During this period, the average return to all U.S farmland was 9.7% with a standard deviation of 6.4%. This composite return encompasses all 50 states.   However, not all regions of the U.S. are suitable for farming or have optimal productivity. An institutional investor also has to consider that that are nine anti-corporate farming states that would make it difficult for them to invest in certain key production states like Iowa.

One way for an investor to maximize their potential returns while gaining operational efficiencies from scale is to invest in a farmland fund that provides broad diversification with farms in several key states. The Promised Land Opportunity Zone Fund (“PLOZ” or “Promised Land”) is one way for investors to capitalize on the durable returns of U.S. farmland while also receiving favorable tax benefits such as a reduced capital gain taxes depending on how long the asset is held. The government defines opportunity zones as urban and rural communities that need significant investment to foster economic revitalization. The current PLOZ portfolio is managed by Farmland Partners in conjunction with Servant Financials’ founder, John Heneghan. Currently Promised Land owns 10 properties of 8,000 acres in North Carolina, South Carolina, Illinois, and Mississippi. These states encompass some of the highest performing states in the U.S.

Using this state composite for Promised Land, the weighted average return of states represented in the fund can be used as a proxy to compare farmland returns with other traditional investments. This is done by weighting the allocation to each of the 5 states by purchase price then finding the average return of these states using the TIAA Center for Farmland Research’s data on cropland return. The return from 1970-2021 across the Promised Land proxy states was 11.1% with a standard deviation of 8.4%. Looking at the more recent term, this farmland proxy had a return of 8.2% with a lower standard deviation of 5.2%.

Note: This analysis uses USDA state-level averages to compare historical returns and does not necessarily represent the returns that an investor would achieve with an allocation to the Promised Land Opportunity Zone Fund.

Relationship of Farmland with Traditional Investments

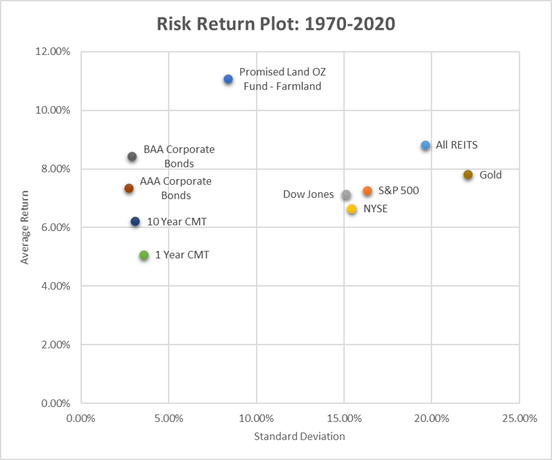
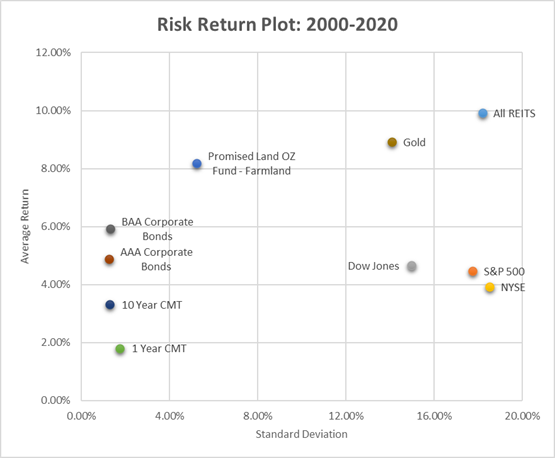
The proxy returns in the Promised Land Opportunity Zone Fund can be compared with other traditional assets such as corporate bonds, stock indices, REITS (real estate investment trusts), treasuries, and gold. Using a risk-return plot under two different time horizons, the position of farmland as an investment can be compared with other investments. Performance metrics from 1970-2020 were examined to show farmland as a longer-term investment compared to a shorter time horizon of 2000-2020. See the figures below for full details.

Data maintained by the TIAA Center for Farmland Research.

The Promised Land OZ proxy demonstrated the highest risk-adjusted return compared to the other asset classes over both time periods.  PLOZ has the optimal position in the upper left-hand quadrant of the graph with a high return and overall lower risk compared to equities, REITS, and gold. Even in the last 20 years, the PLOZ proxy still yielded high, relative returns with lower risk.

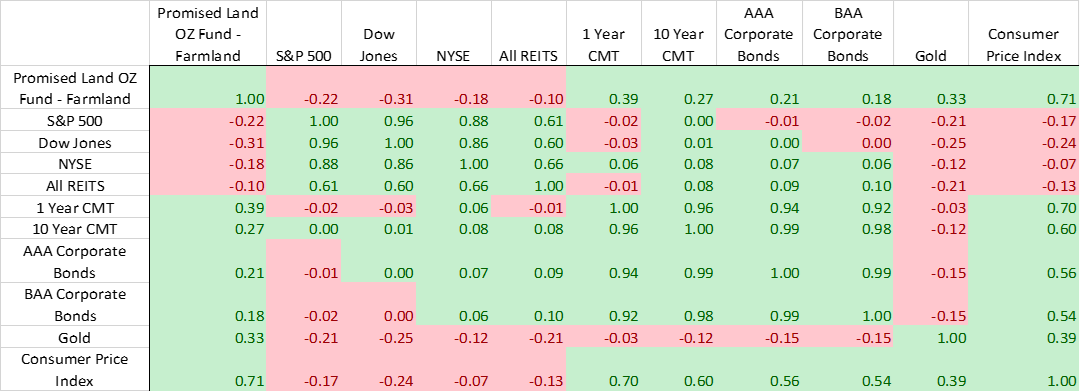
The relationship between farmland and other investments can be further compared by examining the correlation of returns in the chart below.  A value of 1 means two asset classes are perfectly correlated and would be expected to move up or down in tandem.  A negative number suggests the two assets move in the opposite direction over time.

Promised Land’s negative correlation with stocks (S&P 500, Dow Jones, NYSE) gives reason to believe that farmland would provide diversification benefits and offset some of the volatility of these assets with high standard deviations (risk measure). In the more recent past (2000-2020), farmland’s negative relationship with stocks is even stronger with a -.32 correlation with the S&P 500. Note that when the S&P 500 dropped 48.6% in 2008 after the great recession, the Promised Land proxy maintained a positive return of 8.9%.

Relationship of Farmland with Inflation

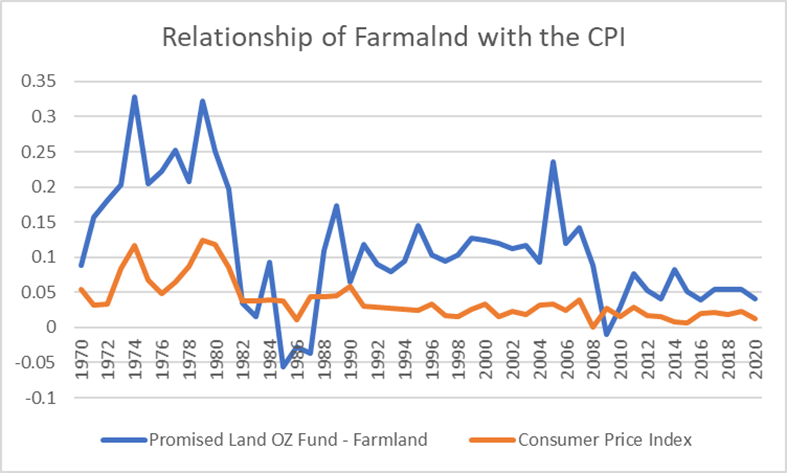
Recently, investors have been concerned about inflation and how they will affect investment portfolios.  The Labor Department recently reported that inflation had hit a 31-year high in October with the consumer price index (CPI) rising to 6.2%. Investors and economists across the globe are wondering if we are witnessing the death of Fed’s “inflation is transitory” narrative.  Historically, stock indices have had a negative correlation with inflation and investors are concerned that these inflationary trends are long-term and secular in nature. Farmland on the other hand has historically provided a nice hedge against times of inflationary pressure. Examining the PLOZ proxy returns with CPI trends shows a positive correlation of .71, meaning historically an increase in the CPI will also increase returns to farmland. Recently this trend has held as some Midwest land is up 20% in value along with the higher consumer prices. See the figure below for more details.

Investment Opportunities

With its potential return and diversification benefits along with its track record as an inflationary hedge, farmland is positioned well to have a complimentary role in a traditional 60/40 (equity/bonds) investment portfolio. To optimize on this potential, investors have a few different options to partake in farmland investing. The most obvious option is to buy farmland directly.   However, this could be costly and comes with the requirement that the investor find capable management for the parcel. Buying a single parcel of farmland also puts the investor at more risk that comes from regional concerns like weather or farm-level (or idiosyncratic) risks like loss of production due to water or soil nutrient levels.

To alleviate some of the parcel management burden while still participate in farmland’s return and diversification benefits could be to invest in the Promised Land Opportunity Zone Fund. The fund is targeting internal rates of return between 8% and 14%, before consideration of the tax benefits it would provide to OZ investors. PLOZ’s mission is to help investors and agricultural communities achieve mutually beneficial outcomes through profitable, durable investing in farmland and the revitalization of rural American communities.  In addition to its core “opportunity zone” impact, Promised Land is evaluating other environmental, social, and governance (ESG) principles, such as farmland preservation, wetland and forestland restoration, organic conversions, and soil health and carbon management practices.  Promised Land’s vision is for these agricultural communities to prosper by feeding the world while OZ investors do well by doing good for these communities and the environment.  If you are interested in learning more about the Promised Land Opportunity Zone Fund, please contact Ethan Rhee at ethan@servantfinancial.com.

Another option for investors would be to invest in Promised Land’s partner: Farmland Partners Inc. Farmland Partners Inc. (FPI) is a publicly traded company that acquires and manages high quality farmland throughout North America. FPI manages the farmland in the Promised Land Opportunity Zone Fund as well. FPI’s current portfolio consists of 157,000 acres in 16 different states. Currently FPI’s stock is trading for just over $12 per share which is up 50% from this time last year. We believe this is an attractive entry point below the fair value of the farmland that FPI owns.   On their third quarter 2021 earnings call, CEO Paul Pittman, commented that the net asset value of the farmland was closer to $14-$15 per share. FPI has also restarted its growth and consolidation strategy.  In addition to direct farmland acquisitions, FPI is growing its asset management business with its property management arrangement with Promised Land and its recent acquisition of Murray Wise & Associates.

With the risk of secular inflation on the rise and the inherent portfolio diversification, an investment in farmland is something all investors should be considering. By including an allocation to farmland in your investment portfolio, you’ll have a much more efficient portfolio and be “one up on Main Street” investors enamored with a traditional 60/40 investment portfolio.

white-arrow