Email us at info@servantfinancial.com to talk to a financial advisor today!

Email us at info@servantfinancial.com

The Rollercoaster Market

Disclosure: This is not investment advice. Consult your investment advisor to make decisions appropriate for your portfolio and life circumstances.

Current Status of Financial Markets

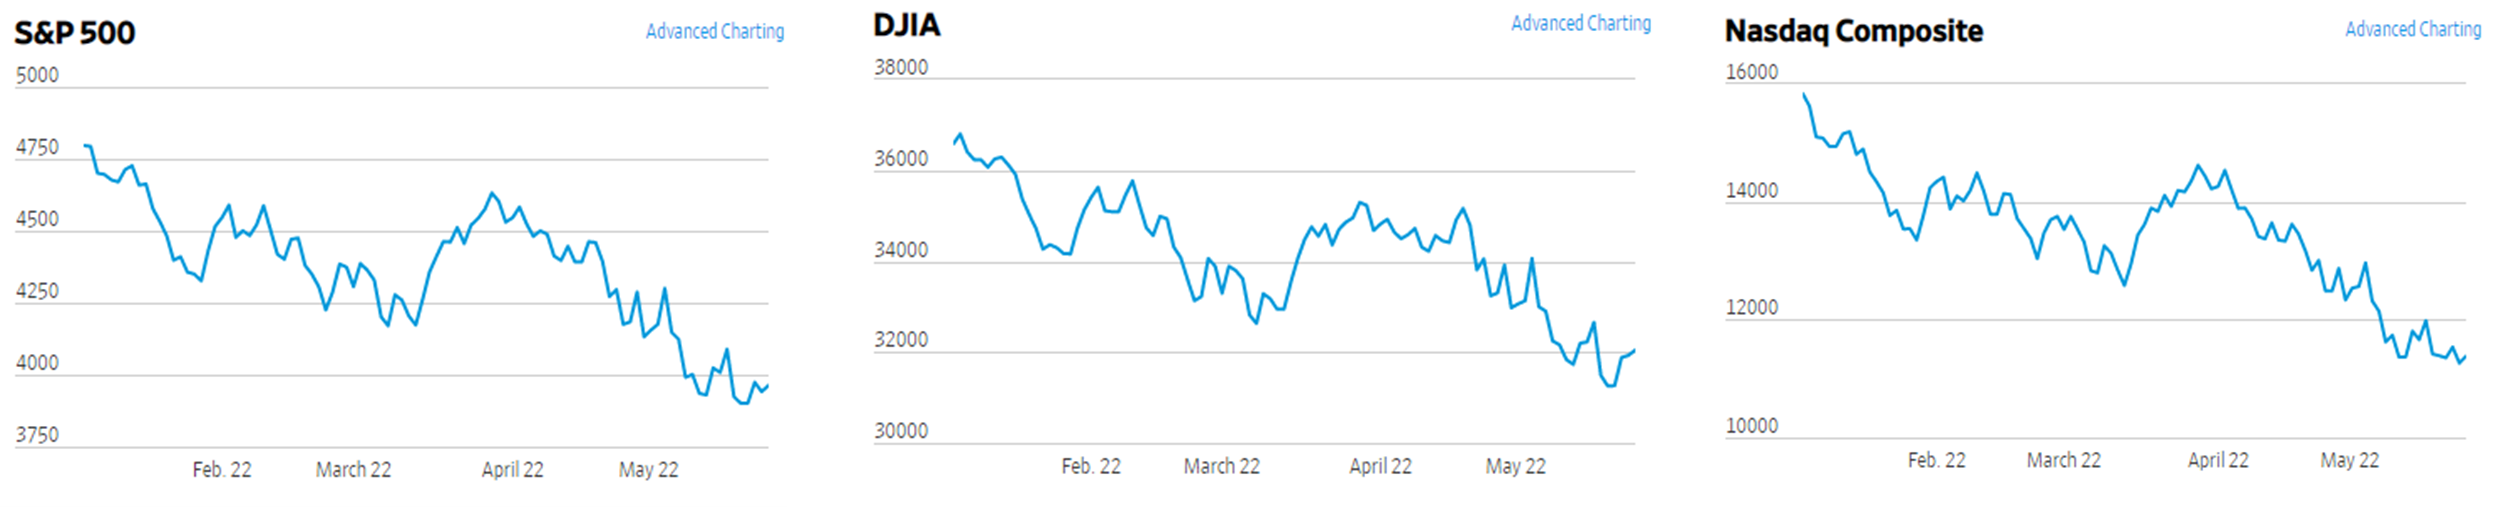
Financial markets have twisted and turned throughout much of 2022 as investors react to inflation, interest rate hikes, and looming concerns from the COVID-19 pandemic. The year-to-date graphs of market indices mimic a rollercoaster heading down a sharp drop before leveling off prior to its next unknown feature – steep ascension, another drop, or into a nauseating barrel roll.  See Figure 1. Ironically, the oldest roller coasters are believed to have been the Russian Mountains, specially constructed ice hills located in St. Petersburg. As in any time in financial history, there are a variety of interlocking factors impacting markets and bringing about recessionary fears. Current circumstances may drive some investors to get off this rollercoaster market, but more seasoned investors will understand the importance of sticking to the long-term plan and riding out the volatility.

Figure 1: Market Indices Performance Year-to-Date

Source: Wall Street Journal

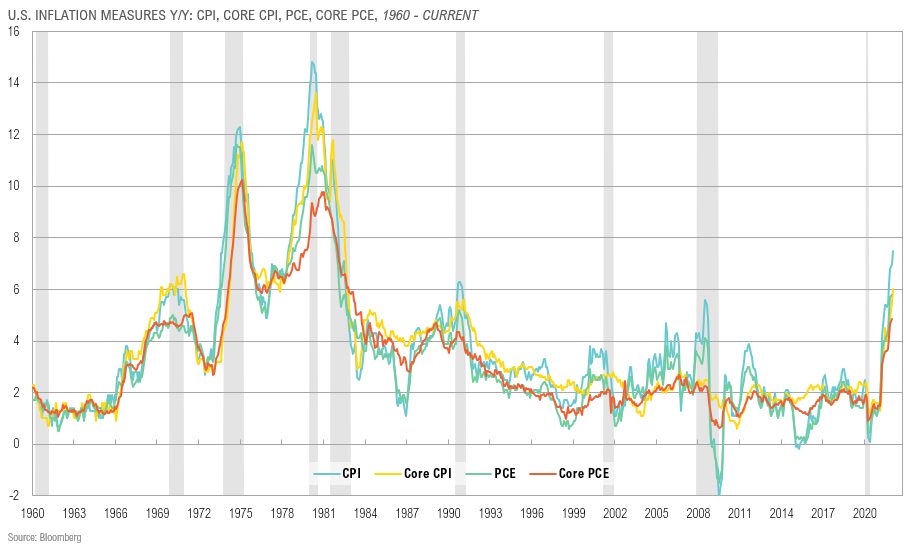
In February, we discussed the impact rising inflation was having on the global economy and since then inflation pressures have remained high. The U.S. annual inflation rate slowed slightly in April to 8.3% from 8.5% in March with the largest inflationary pressure stemming from the energy and food sectors. That comes as no surprise considering the U.S. average gas price is at $4.60/gallon, up from $3.04/gallon just one year ago. Escalating inflation prompted the Federal Reserve to adjust its monetary policy by raising interest rates 0.50% on May 4th, the biggest increase in two decades. Based on Fed Chairman Jerome Powell’s remarks after the decision, more 50-basis point rate hikes should be expected to curb inflation. The Federal Reserve’s policy actions prompted 30-year fixed-rate mortgages to rise to 5.27% on May 5th.   Home sales are starting to slow as financing becomes more expensive and house ownership less affordable for consumers. Americans are beginning to wonder if there is an end in sight to rising costs and fluctuating financial markets.

Another factor causing inflationary pressure for consumers is ongoing supply chain issues. It has been more than two years since the start of the COVID-19 pandemic; however, the U.S. supply chain continues to struggle to meet demand. Recently, supply chain woes have especially impacted families with infants due to the baby formula shortage caused, in part, by bacterial contamination in Abbott Nutrition’s factory in Michigan. Abbott accounts for 40% of the market share for baby formula and the resulting plant closure has decimated the supply of baby formula. Supply chain shortages continue to be an issue in every industry from car manufacturing to food production. Not only is there a shortage of raw materials, but labor shortages have become a mounting problem. Shortages in truck drivers and warehouse workers are greatly impacting the manufacture and delivery of raw materials and finished goods.

On top of all this, geopolitical issues are straining global financial markets as the desire for socioeconomic justice persists. The Russian invasion of Ukraine has caused the U.S. and several other countries to place economic sanctions on Russia. The U.S. has focused its efforts on sanctioning Russian banks, bans on Russian oil and travel, and asset confiscations for Russian oligarchs, among other things. The European Union (EU) has responded similarly to the U.S. and is now proposing a complete ban on Russian oil which would likely put further pressure on global oil and gas prices. The EU, particularly manufacturing powerhouse Germany, is highly dependent on Russian natural gas and oil.  Looming geopolitical pressures between China and Taiwan have also sparked more volatility in financial markets as President Biden said on May 23rd that the U.S. would defend Taiwan if China invaded. An invasion of Taiwan could bring about enormous economic disruption between the U.S. and China, causing more supply chain and inflation problems as China is the United States’ largest trading partner.

Bear Market Territory

The recent stock market drop from nose-bleed valuations was incited by unabated inflation and the Fed’s untimely interest rate hikes to “rail in” its excessively accommodative monetary policy. The Fed is playing catchup after continuously assuring markets that inflation was transitory. Unfortunately, markets have suffered from this adjustment, and bear market worries have ensued. Technically, a bear market occurs when an index or individual stock takes a roller coaster-like plunge of 20% or more from a recent high. The S&P 500 has been hovering near bear market territory as it is down -17.8% year-to-date. The Nasdaq is already in bear market territory down -28.0% year-to-date.  The Dow Jones Industrial index has experienced a tamer ride, down -12.1% year-to-date. These metrics have investors on this monetary policy-induced joy ride wondering if they need to be concerned with a longer-term bear market and a potential recession or worse. Experts at Moody’s analytics and the Wall Street Journal say that the chance of a recession is around 30% and will increase if inflation is not subdued.

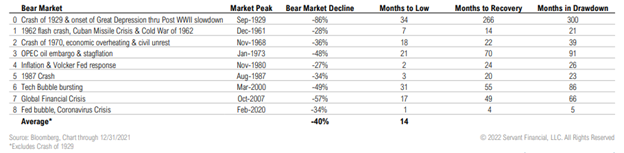
Seasoned investors know that bear markets are inevitable, and they don’t last forever. See Figure 2. The most recent bear market in the S&P 500 was prompted by the COVID-19 pandemic and economic fallout from government-mandated lockdowns which caused the index value to fall -34%. However, this steep drop was followed one month later by an epic ascension. See Figure 3. Other recent bear markets such as those associated with the Global Financial Crisis and the Tech Bubble burst lasted 17 and 31 months, respectively, before climbing back into a bull market. While this graph might shake younger, trade-oriented investors, seasoned investors understand that this is another cycle that the market must take.

Figure 2: Historical Bear Market Cycles

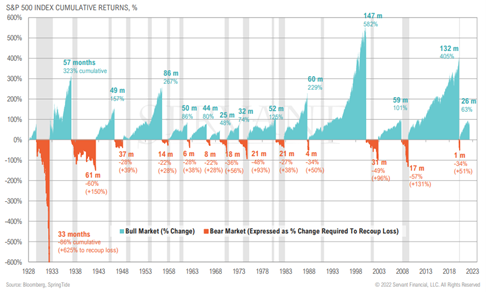
Figure 3: Historical Bear Market Events

Market Performance of Non-stock Market Investments

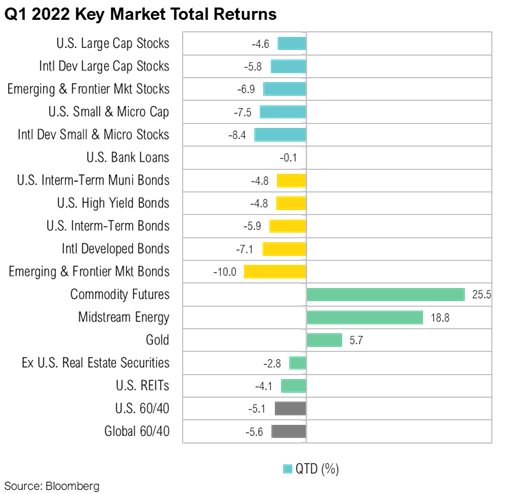
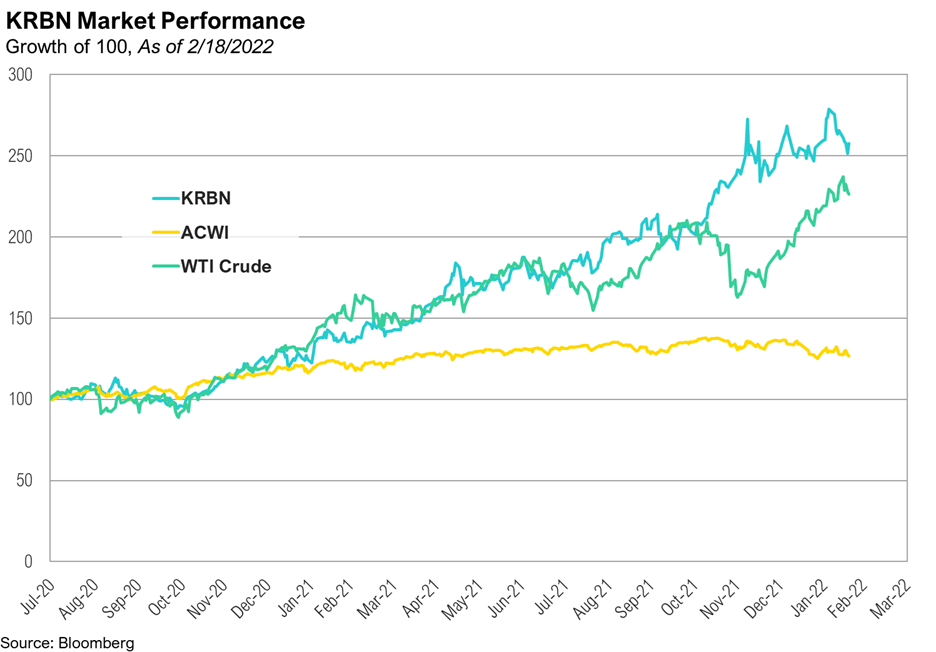
Although the broad stock market has been descending since January, other sectors have experienced positive returns. For example, the energy sector has been profiting from the runup in overall energy prices and Bloomberg reports the sector is up 1.9% this year. This is the second-best sector performance behind consumer discretionary spending which is up 3.0%. Not only is traditional energy investing trending right now but more investors, particularly, ESG (Environmental Social and Governance) investors are allocating more capital into the alternative energy space. Rising oil prices have both investors and consumers realizing the United States needs to evaluate its dependence on fossil fuels and how the transition to renewable energy sources could be managed more smoothly and strategically.

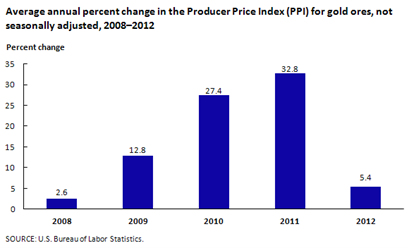
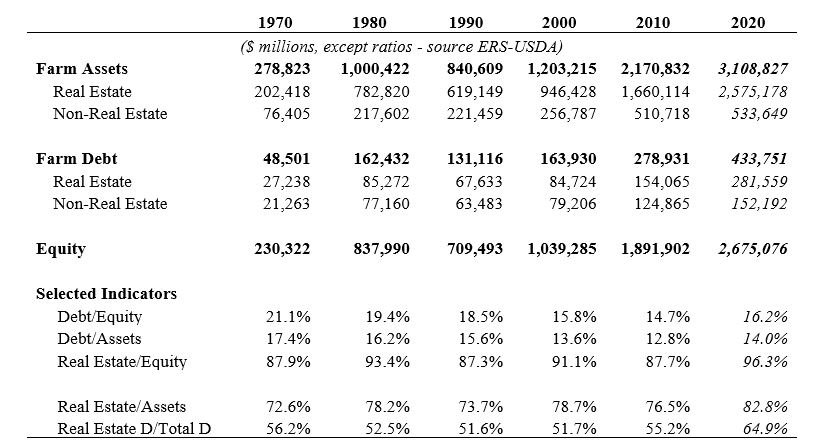
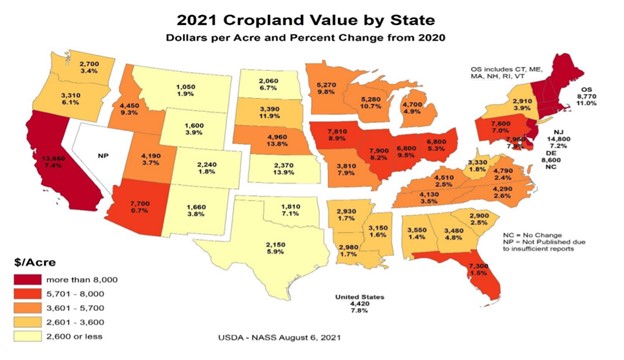
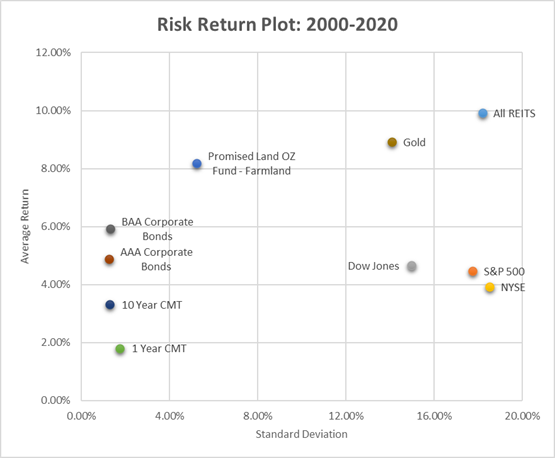
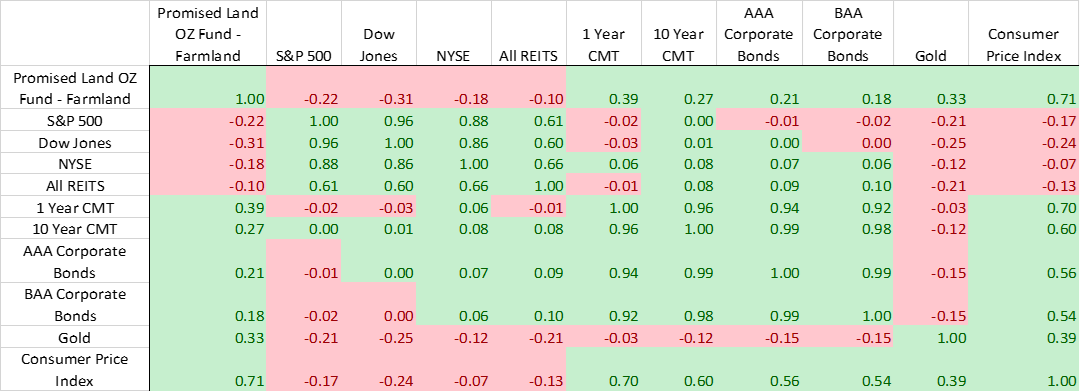
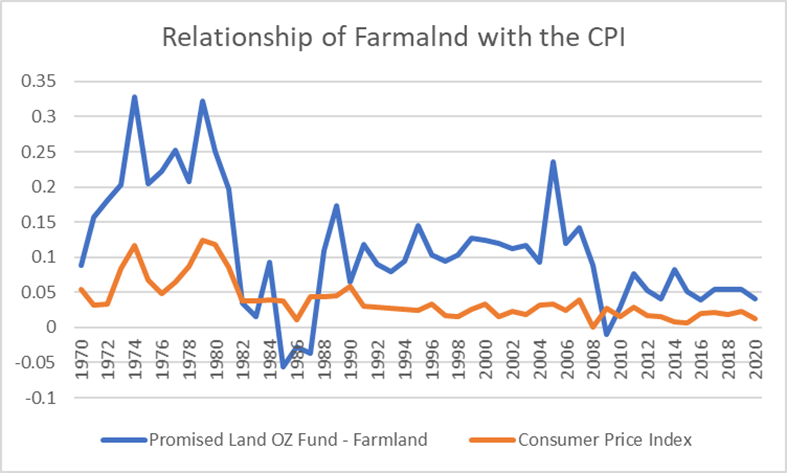
Another industry experiencing favorable returns year-to-date is the agricultural industry. The COVID-19 pandemic and rising inflation only highlighted the importance of a stable, secure food supply and that regardless of what is happening in the global economy, people still need to eat. Farmland, which historically has a positive relationship with inflation, has experienced strong returns throughout 2021 and 2022. Farmland values have soared 20-30% this year alone with the largest gains seen in the Corn Belt of the Midwest. Strong commodity prices are bolstering returns as corn, soybean, and wheat prices have been surging due to the geopolitical uncertainty in Russia and Ukraine, both large producers of bulk agricultural commodities. While the U.S. growing season is just getting started, strong grain prices are making for favorable market dynamics and improved farm profitability.

Riding the Volatility Spins

The volatility in the stock market may have some investors worried about their portfolio security.  If market history has taught us anything, it’s those long-term investors that get in and stay in that realize the best investment performance.  Trying to time the market’s natural gyrations is generally a fool’s errand.  Staying the course with a sensible asset allocation and enjoying the ride has proven itself time and time again.

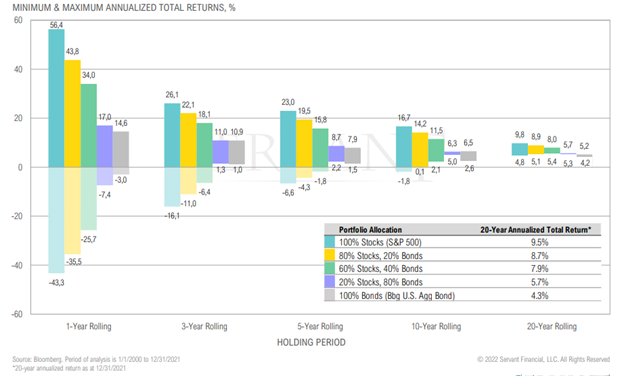
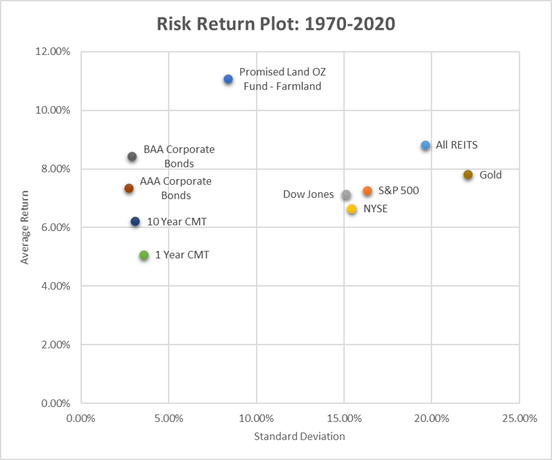
The S&P 500 has a 20-year total return of 9.5% and as investors allocate more to stocks and less to bonds, their return potential rises. See Figure 4. Allocating more to stocks also historically means more volatility.  Figure 4 also shows that the longer the investment horizon, the lower the overall risk. Investing just 1 year in any asset can give any investor significant exposure to risk but as their investment horizon lengthens, they can smooth out much of that volatility associated with shorter time horizons. If we compare the recent year-to-date graphs of market indices (Figure 1) with the long-term performance of each of these indices we see that while there are periodic dips, in the long run, the market proceeds on a steady upward trend. This comparison leads to the conclusion that the best thing to remedy volatility, is time. The same goes for riding a rollercoaster. While on the rollercoaster, you may be tempted to want to stop the ride on that nauseating barrel roll. But if you roll with the changes and ride it out to the end, you may realize the thrill and enjoyment and find yourself back on the ride again.

Figure 4. Historical Returns Through Time

Re-Evaluating the Role of Gold in Investment Portfolios

2022 has proven to be a particularly interesting and bumpy ride for investors as we travel the economic path toward the end of our rainbows and the achievement of our long-term savings and investment goals. Recent monetary policy and global events have investors reconsidering what role gold plays in a modern investment portfolio. Diversification into inflation hedging assets, such as gold, will be a key consideration for investment portfolios to manage the inflation bumps and monetary policy U-turns. In many respects, the market has indicated early in 2022 that what may be the key to surviving this rocky economic road is by looking ahead to what’s at the mythical end of the rainbow: a pot of gold. 

Gold Rush

What do today’s investors and gold prospectors from the 1800s have in common? They are both rushing to get their hands on gold. Inflation woes and market uncertainty have rightfully sent the gold market into a frenzy as investors seek its real asset protection. As of April 25th, gold’s value is up around 10% from the previous year and is up 22.8% since right before the pandemic began in March 2020. While it has given up some gains in recent weeks, it still has strong year-to-date returns. Frankly, gold has been a sparkling investment since 1999 when its price averaged around $252.50 per ounce. Today, gold is trading at closer to $1,900 per ounce, creating a strong upward trend over the last 23 years. Gold reached an all-time high on March 9th when the price of the “barbarous relic” topped out at $2,053.60. Volatility still plagues the real asset but for gold investors who have buried American Eagle coins, gold bars, or equivalents in their safety deposit boxes or investment portfolios, the reward has paid off.

Speculators have questioned whether this gold rush will continue throughout 2022. To be certain, gold prices will be very dependent on what happens with inflation, interest rates, and the Russian/Ukrainian conflict.  The barbarous relic’s bullish trends are currently projected to continue throughout 2022 but even the most optimistic investors will continue to keep an eye on its volatility because as we have experienced “All that glitters is not gold.” – William Shakespeare.

Gold Performance During Economic Crisis & Inflationary Pressure

Real assets such as gold or real estate like farmland have often been favored during times of economic crisis and global uncertainty since fiat money printing becomes global governments’ default solution. Investors flocked to real assets during The Great Inflation of the 1970s when unemployment levels were high, and the economy was turbulent. We saw similar circumstances during the 2008 Global Financial Crisis. Initially, gold also faced considerable volatility in 2008 as investors sought liquidity across all investment holdings.  After the initial shock of the financial crisis, people bought gold when they sensed that the money printing had started in earnest. Growth slowed down in 2012 as the Federal Reserve lowered interest rates and a weaker dollar resulted. The figure below shows the annual price movements of gold during this time period.

Source: U.S. Bureau of Labor Statistics

              The most recent notoriety surrounding gold has understandably been driven by its relationship with inflation. Recently inflationary numbers accelerated with CPI growing more than 8% year over year and the narrative has flipped from “transitory inflation” to “secular inflation” and there is a growing concern for stagflation (slow economic growth with high inflation). The Federal Reserve has reversed course and dropped its inane “transitory” policies and is aggressively raising interest rates to temper demand and combat rising prices. However, with supply chains still recovering from the COVID-19 pandemic, the Russian/Ukraine conflict has thrown another wrench into global economic gears as the market for commodities, such as oil, gas, and grains grows more fractured.

What does all of this have to do with Gold? Well, this considerable market uncertainty has investors accumulating real assets and gold because of its historical positive correlation. In the past, as inflation levels have risen so has the price of gold. We discussed this dynamic in more detail in our February insight. Gold’s positive correlation with inflation has continued to hold in 2022 with gold prices peaking just as investors are seeking protection from high inflation.  The following table shows the correlations of various asset classes, including gold, to Consumer Price Index (CPI).

Historical Correlations of Financial Assets with Inflation (1970-2020)

Source: Data supplied by the TIAA Center for Farmland Research

Gold’s Performance in an Investment Portfolio

Gold can play a valuable role in an investment portfolio not only for its inflation hedging capabilities but also for its historical negative correlation with bonds and equities given its safe-haven attributes in times of war and geopolitical turmoil. Some investors argue that gold is unattractive within an investment portfolio because of its volatility and inability to produce an income stream. However, asset allocators and investors might be rethinking portfolio construction as recessionary fears persist and U.S. stock indices continue their volatile fall. The S&P500 is down –11.25% year to date with the NASDAQ and Dow Jones also posting similar losses for the period of -18.05% and -6.14%, respectively. In contrast, gold is up close to 4% year to date and investors are aggressively rethinking their portfolio diversification strategies.

Source: Q1 Market Commentary

              There are a variety of alternatives for investors to gain exposure to the gold market.  The most obvious is buying gold coins or bullion directly and storing them in a secure vault at a financial institution. Buying gold directly is unlikely to be the best option for many investors due to the high frictional cost of storage and security for the physical asset. Another option would be to invest in the supply chain for gold such as gold miners. Barrick Gold Corporation (GOLD) is the largest gold company in the world. The Toronto-based company mines, processes, and has reserves across five continents. Its stock price is up 7% year over year.  A more diversified gold mining play is the VanEck Gold Miners ETF up 20% year over year.  For investors seeking less direct gold exposure but still scouting for inflation protection, Horizon Kinetics Inflation Beneficiaries ETF (INFL), offers broad diversification benefits. We wrote about INFL in February when it was added to the Servant Financial portfolio. It currently has $896 million in assets under management with holdings in gold and other mining companies, energy and food infrastructure, and transportation: all sectors that have experienced some of the most positive price movements in the underlying commodities or products and services.

Traditional investment theory cites the most prevalent portfolio benchmark is a 60/40 split in an

investment portfolio with 60% equities or stocks and 40% fixed income instruments or bonds. Under this portfolio model, investors would be down -5.6% quarter to date as both U.S. stocks and bonds were hammered by rising inflation. The performance of the traditional 60/40 portfolio compares unfavorably with Servant Financials’ sample moderate risk client. The Servant model portfolio also holds a diversified mix of global equities and bonds but also includes a healthy allocation to precious metals. This inflation-protected model portfolio was down only -0.57% quarter to date. See the accompanying asset allocation chart.

Within this Servant model portfolio, INFL had total returns of 8.8% for the first quarter of 2022, Berkshire Hathaway Class B shares (+17.6%), Farmland Partners Inc shares (+14.6%), and various precious metal investments (GDX +19.0%, Sprott Gold & Silver Trust +8.9% and iShares Silver ETF +7.2%) accounted for the bulk of the favorable performance variance to the traditional 60/40 benchmark.

We will continue to monitor the performance of gold and other inflation hedges and adjust asset allocation as we chart the optimal path to the achievement of your long-term savings and investment goals. If you would like to discuss your financial situation and how to secure that pot of gold at the end of your investment rainbow, please contact us at john@servantfinancial.com.

Carbon-Nation: Intro to Carbon Markets

Although agriculture is the fourth leading source of greenhouse gas emissions (see Figure 1), agricultural land also has the unique ability to store carbon dioxide in soils, plants, and trees. Because of this unique ability, recently, there has been a lot of focus on agriculture as a way to reduce greenhouse gas emissions. One report suggests that U.S. agriculture and forestry sectors can provide 10-20% of the sequestration and emission reductions needed to reach net-zero emissions by 2050. Current carbon sequestration on U.S. cropland is 8.4 million metric tons of carbon dioxide equivalents  per year (“CO2–eq  per year”) and the estimated annual sequestration potential is 100 million metric tons of CO2–eq  per year (source).

When considering the chart of emissions by economic sector, we see the three largest emitters are the transportation, electricity generation, and industry sectors. These three sectors alone account for approximately 77% of the total U.S. greenhouse gas emissions. Reducing emissions in these sectors typically requires long-term changes. For example, a shift toward electric cars in the transportation industry or solar or wind power in the electricity generation industry requires infrastructure changes and technology shifts, which have long lead times. One advantage of agriculture is its ability to make changes relatively quickly compared to the other larger emitting sectors. Within one growing season, farmers can adopt a practice such as cover crops or no-till that sequesters significant carbon and reduces greenhouse gases.

Several traditional agricultural seed and input companies and emerging agricultural technology (“agtech”) companies have been working to quantify and monetize the environmental benefits of agriculture. These agtech companies have begun launching private agricultural carbon markets for farmers.   Farmers can enroll their acres and adopt new practices that sequester carbon in the soil such as planting cover crops, adopting no-till or reducing their tillage, or reducing their nitrogen application. The sale of carbon credits presents an opportunity for farmers to receive financial benefits from changing to more environmentally beneficial agricultural practices, although carbon prices offered to farmers may not currently be high enough to cover their cost of switching practices. Information about carbon markets can be opaque and challenging to navigate because each carbon company typically has a different structure for payments, verification, and data ownership.  Many farmers are skeptical of these unregulated, “market” based programs.


Why Now?

The increased interest agricultural carbon markets stems from President Biden’s Executive Order on Tackling the Climate Crisis at Home and Abroad from January 27, 2021. This order specifically mentions “America’s farmers, ranchers, and forest landowners have an important role to play in combating the climate crisis and reducing greenhouse gas emissions, by sequestering carbon in soils, grasses, trees, and other vegetation and sourcing sustainable bioproducts and fuels.” As part of this executive order, the USDA collected input from the public about how to encourage the voluntary adoption of climate-smart agricultural and forestry practices. Stakeholders were also requested to make specific recommendations to the USDA for an agricultural and forestry climate strategy. The result of this initiative is the recent announcement by the USDA to use the Commodity Credit Corporation (CCC) to invest $1 billion in funding for pilot programs that use climate-smart practices and develop methodologies and practices to accurately and efficiently measure the greenhouse gas benefits4.

Chicago Climate Exchange (CCX)

Previously, there was a greenhouse gas reduction and trading project for emission sources and offset projects that could also be used for agriculture. The Chicago Climate Exchange (CCX) was a stock exchange for emission sources and offset projects that traded carbon credits from 2003 to 2010 (source). Some ways farmers could participate in CCX were through soil best management practices (continuous conservation tillage and grazing land best management practices), methane capture and destruction, reforestation, and fuel switching. In 2009, the CCX had over 9,000 farmers and ranchers enrolled, covering 16 million acres (source).

One significant challenge the previous CCX platform faced was a greater supply of carbon sequestration practices than market demand, driving down the price of credits. Today, the situation and market structure may be completely different. One-fifth of the world’s largest publicly listed companies have announced net-zero emissions targets. Furthermore, the U.S. has also pledged to reach net zero emissions by 2050. Some companies who purchase agricultural goods may need to specifically reduce their scope 3 emissions, which are the indirect emissions contained in the goods. For example, if a company purchases corn, the scope 3 emissions are emissions that went into producing the corn, such as fertilizer and fuel. One example of a company who purchased agricultural carbon credits is Microsoft, who purchased $2 million in carbon credits from Truterra, a subsidiary of the U.S. farmer cooperative Land O’Lakes in 2021. The new policy initiatives and public sector investment in climate smart agriculture by the USDA may catatlyze the market for agricultural carbon credits by providing more regulatory structural certainty for the carbon market today compared to the past.

How Farmers Participate

The main way farmers participate in agricultural carbon markets is through private companies who help farmers produce, verify, and sell carbon offsets in a marketplace or directly pay farmers for adopting new practices. Some select agricultural carbon market programs are shown below:

These companies typically use an estimation model to estimate the change in a farmer’s soil carbon from adopting a new practice and then pay the farmer based on this change. Many companies also use periodic soil testing in conjunction with modeling to verify results. Typically, most companies are guaranteeing farmers a minimum of $15 to $20 per carbon credit, where a credit is equal to one metric ton of CO2–eq. Many carbon industry experts are projecting that price to go up to $30 per credit in the upcoming year based on projected demand growth for carbon.

Opportunities for Carbon Market Investment

Although there is not a specific investment offering for agricultural carbon markets yet, there are broad-based carbon markets available that could indirectly affect those who own and invest in farmland. The opportunity of landowners and farmers to participate in these private agricultural carbon markets could generate some extra revenue on the farm, especially if carbon credit prices increase. More broadly, there are already existing opportunities for farmers, landowners, and environmentally conscious investors to allocate capital to carbon allowance ETFs.

Regulators across the globe are experimenting with policies to try force a transition to more renewable energy sources while attempting to minimize the economic fallout.  One such policy tool is carbon taxation and the associated carbon credit (or allowance) market prevalent in the European Union (EU).  One carbon allowance allows a firm to emit one metric ton of CO2. These allowances are auctioned off by the governing body that oversees the emissions trading system (ETS) and major carbon emitters are forced to buy an allotment of allowances equivalent to their estimated CO2 emissions. As all carbon emitters in a particular region need to buy these credits, the market sets a price based on the demand for fossil fuels and the restricted supply of carbon allowances.

Major markets have been established for carbon allowances in Europe, the United States, Asia and Australia. In the aggregate, it is estimated that the total size of these markets has reached $600 billion in 2021. The largest market is the EU ETS, which governs the 27 EU member states plus Iceland, Liechtenstein, and Norway and accounts for 41% of the EU’s greenhouse gas emissions. There are four carbon allowance ETFs available at this time –  KraneShares Global Carbon Strategy ETF (KRBN) (link), KraneShares California Carbon Allowance Strategy ETF (KCCA), KraneShares European Carbon Allowance Strategy ETF (KEUA), and iPath Series B Carbon ETA (GRN).

The largest and most liquid ETF KRBN tracks the major European and North American cap-and-trade programs (European Union Allowances (EUA), California Carbon Allowances (CCA) and the Regional Greenhouse Gas Initiative (RGGI) emission trading systems.  KRBN ETF’s assets total $1.8 billion.

The following chart summarizes the historical performance of KRBN ETF versus West Texas Intermediate crude (WTI) and All Country World Equity Index (ACWI).

Servant Financial has no formal recommendation on KRBN at this time given the volatile inflation and energy market dynamics and the Ukraine war.  In particular, the EU dependence on Russian oil and gas makes for a potential backdrop for easing of environmental standards to alleviate populous backlash on rising energy costs.  An allocation to KRBN may be a suitable consideration for more risk tolerant investors wishing to invest with purpose in an environmentally more sustainable planet for future generations.

Going, Going, Gone! Is Inflation Running Away with our Money and our Investment Returns?

On the field that is the U.S. economy, currently loading the bases are looming interest rate hikes, the value of the U.S. dollar, and rising Treasury yields. On the mound, is Federal Reserve Chairman, Jerome Powell, and everyone from investors to consumers are waiting to see what will happen next with monetary policy and the economy. Early in the game, the COVID-19 pandemic threw a curveball, and ever since, the economy has been dribbling a series of weak grounders from persistent unemployment, to supply chain disruptions and a declining labor force participation rate. Will Chairman Powell toe the rubber to strike out runaway inflation and imperil economic growth or is the US economy in for extra innings?

How did inflation get so out of hand?

The U.S. Bureau of Labor Statistics reported that in January 2022, the consumer price index rose 7.5% from January 2021, the highest rate of inflation since February of 1982. Some of the industries seeing the largest price hikes are the energy, gasoline, housing, and food sectors which is of no surprise for anyone who has bought groceries or visited the gas pump lately. Even with the rise in prices, it hasn’t generally stopped consumers from spending. The Commerce Department reported that retail sales are up 3.8% year over year with large gains reported in vehicle, furniture, and building supply purchases. Home sales have been on the rise as well with the National Association of Realtors citing that home sales in January were up 6.7% from the previous month. This comes as home buyers are trying to secure financing at lower interest rates before the anticipated Federal Reserve rate increase next month.

Source: SpringTide US. Inflation Trends

While this level of inflation is unlike anything Americans born after the 1970s and early ‘80s have ever experienced, many economists are not surprised by this spike in the CPI. The federal government has shelled out more than $3.5 trillion in COVID-19 relief funding in the form of stimulus checks, unemployment compensation, and the paycheck protection program. The figure below shows the allocation of this spending with more spending earmarked through 2030 as the government continues to combat the aftershocks of the pandemic. The excess liquidity in the market, combined with the supply chain disruptions and labor shortages, has created the perfect cocktail for inflation to brew. While this spending was necessary to keep the economy out of a recession, some argue the federal reserve hasn’t been aggressive enough in unwinding its pandemic era policies to combat rising inflation. The Federal Reserve has announced that rates will start to rise in March, but by how much? Experts, such as economists at Citibank, are predicting anywhere from a 25 to 50-basis point hike with the later end of the spectrum becoming more likely as inflation rises. They are then expecting three to four more 25-basis point hikes by the end of 2022. Economists feel this could help slow inflation by the end of the year, but supply chain disruptions and incipient wage inflation risk still loom.

Source: CNBC analysis of Treasury data compiled by the Pandemic Response Accountability Committee

Is 2022, the new 1980?

The survivors of the last battle with inflation in the 1970s and 80s know all too well what runaway inflation looks like.  It has some questioning whether we are in for a blast from the past in 2022. Inflation peaked in 1980 at 14.8% and while we haven’t hit those levels yet, the jump we have experienced has people on their toes for a line drive heading for them. Inflation in the ’80s was driven by a variety of factors from unpredictability in interest rates to soaring oil prices. Most economists believe that this time is different than the 1980s as recent inflation has been caused by COVID-19 aftershocks of excess liquidity and supply chain issues. These factors are expected to normalize over time.

Examining our Investment Strategy

Markets have been off to a shaky start in 2022 with inflation and geopolitical risks in Russia & Ukraine driving the recent volatility. Economists and investors worry that if war broke out between Ukraine and Russia, it could cause more supply chain disruptions of commodities which could prolong inflation. While the Federal Reserve’s announcement of a March interest rate increase has curbed some concerns about more inflation, these new geopolitical risks could overshadow efforts to reduce inflation through monetary policy. As a result, investors are watching markets closely in addition to exploring inflation-protected physical assets such as gold or farmland. Below is the historical correlation between several asset classes and the consumer price index using returns data from 1970-2020. The CPI has historically had a positive relationship with bonds and precious metals but a negative relationship with equities.

Source: Data supplied by the TIAA Center for Farmland Research

Physical assets such as precious metals and farmland have taken center stage the past few months with gold values up 5.3% year to date and farmland values up 22% in parts of the Midwest since this time last year. While these physical assets have been investors’ go-to during high inflationary periods in the past, investors have also been allocating more of their portfolios to cryptocurrencies as well. Cryptocurrencies have a relatively short history compared to traditional assets which makes it difficult to analyze their performance with inflation, however, some investors are calling it “digital gold.” Even Mr. Wonderful, Kevin O’Leary, claims that his portfolio has more holdings in cryptocurrencies now than gold. Crypto enthusiasts cite its ability to be shielded from the effects of government money printing and spending largesse.

Servant Financial has been keeping tabs on inflation and has updated its investing strategy accordingly based on investors’ risk tolerance. While we are still allocating a portion of portfolios to equities and fixed income instruments, we’ve had a higher portfolio tilt towards allocation to precious metals, real assets, and Grayscale Bitcoin Trust (BTC) as protection for client portfolios from inflation. INFL, Horizon Kinetics Inflation Beneficiaries ETF, has recently been added to the portfolio as well. It is an actively managed ETF designed to capitalize on growing inflation trends. Currently, INFL has $896 million assets under management with holdings in transportation, financial exchanges, energy and food infrastructure, real estate, and mining companies. While INFL has a diverse group of global holdings, its top holdings are in PrairieSky Royalty (Oil & Gas), Archer Daniels Midland (Food & Agribusiness Processing), and Viper Energy Partners (Oil & Minerals).

While inflation has threatened investors’ portfolio returns, an adjustment in investment strategy for the purposes of inflation hedging will help investors score in the performance game in the later innings of this economic cycle. A watchful eye must be kept on key economic signals such as changes in interest rates, inflation trends globally, and the supply chain normalization. If you would like to discuss your asset allocation so you can do well in all facets of the investment game like the alert and observant Willie Mays, the Say Hey Kid (Say who. Say what. Say where. Say hey.), contact Servant Financial today.

One Up On Main Street – A Farmer’s Daughter’s Guide to Farmland Investing

Author’s Note

“This past month, I defended my master’s thesis on the Role of Farmland in a Mixed Asset Investment Portfolio. Under the direction of Dr. Bruce Sherrick at the University of Illinois at Urbana-Champaign, I explored how an investment in farmland can interact in an investment portfolio of equities, bonds, and treasuries in addition to how it can hedge against inflation. Using data maintained by Dr. Sherrick and courtesy of the TIAA Center for Farmland Research, I analyzed the returns to farmland from 1970-2020 and some of my results are discussed below in addition to introducing farmland as an asset class to institutional and individual investors.” – Ailie

Background on US Farmland

Farmland is a unique asset class in that it has a limited supply and potentially an unlimited useful life. Only 17.2% of the United States landmass is considered arable.  With a growing world population projected to reach 9.7 billion by the year 2050, farmland is well positioned as a production source for a basic human need: food. Not only is the population rising but income levels are also expected to follow suit with world GDP projected to double by 2050. These statistics suggest that demand for food is going to go up and the composition of caloric intake is expected to change. Research shows that protein consumption rises with rising income levels.  With a significant portion of farmland acres dedicated to either feeding livestock or producing other protein sources like chickpeas or lentils, farmland owners and operators are uniquely positioned to meet this demand and profit from it. So long as humanity needs food, there will be economic rewards for the cultivators and landowners.

Farm Balance Sheet

If an institutional or individual investor was investing in a company’s common stock or buying a corporate bond, they would typically examine the balance sheet of the company. The same is true for investing in farmland. Farmland has grown in value significantly over the last 50 years with a 55% increase in the last 10 years alone. Farmland (Real Estate in the table below) dominated the asset side of the farm sector’s balance sheet encompassing close to 83% of total assets. Under the recent low-interest-rate environment, farmland’s debt level has also grown but this is still significantly less than the portion of farm assets it supports. The overall low debt to equity ratio of 16.2% demonstrates a very conservative leverage position relative to other real asset sectors and the relative strength of the U.S. Agriculture industry as a whole.

Data maintained by the TIAA Center for Farmland Research based on data from the Economic Research Service, a sector of the USDA

Returns to Farmland

Like any real estate asset, farmland receives returns when held by an investor in two ways: appreciation in value and cash flow generated from rental income. In 2021, the U.S has experienced a rise in both. According to the USDA, farmland prices are up 8% from last year.  Record sales prices of farmland have been occurring throughout the U. S.’s key growing regions.

August 2021 USDA Land Values Summary

On the rental income side, most investors would be participating in a straight cash rent system meaning a farmer pays the landowner a fixed amount per year for the use of the land. Recently, the U.S. has experienced growth in cash rent values along with the rise in farmland prices.  Fueled by strong commodity prices, healthy farming profits, and appreciating land value, cash rental rates are projected to rise 10% in 2022.

To examine a longer-term horizon of historical returns to farmland, data from the TIAA Center for Farmland Research was utilized from the years 1970-2020. During this period, the average return to all U.S farmland was 9.7% with a standard deviation of 6.4%. This composite return encompasses all 50 states.   However, not all regions of the U.S. are suitable for farming or have optimal productivity. An institutional investor also has to consider that that are nine anti-corporate farming states that would make it difficult for them to invest in certain key production states like Iowa.

One way for an investor to maximize their potential returns while gaining operational efficiencies from scale is to invest in a farmland fund that provides broad diversification with farms in several key states. The Promised Land Opportunity Zone Fund (“PLOZ” or “Promised Land”) is one way for investors to capitalize on the durable returns of U.S. farmland while also receiving favorable tax benefits such as a reduced capital gain taxes depending on how long the asset is held. The government defines opportunity zones as urban and rural communities that need significant investment to foster economic revitalization. The current PLOZ portfolio is managed by Farmland Partners in conjunction with Servant Financials’ founder, John Heneghan. Currently Promised Land owns 10 properties of 8,000 acres in North Carolina, South Carolina, Illinois, and Mississippi. These states encompass some of the highest performing states in the U.S.

Using this state composite for Promised Land, the weighted average return of states represented in the fund can be used as a proxy to compare farmland returns with other traditional investments. This is done by weighting the allocation to each of the 5 states by purchase price then finding the average return of these states using the TIAA Center for Farmland Research’s data on cropland return. The return from 1970-2021 across the Promised Land proxy states was 11.1% with a standard deviation of 8.4%. Looking at the more recent term, this farmland proxy had a return of 8.2% with a lower standard deviation of 5.2%.

Note: This analysis uses USDA state-level averages to compare historical returns and does not necessarily represent the returns that an investor would achieve with an allocation to the Promised Land Opportunity Zone Fund.

Relationship of Farmland with Traditional Investments

The proxy returns in the Promised Land Opportunity Zone Fund can be compared with other traditional assets such as corporate bonds, stock indices, REITS (real estate investment trusts), treasuries, and gold. Using a risk-return plot under two different time horizons, the position of farmland as an investment can be compared with other investments. Performance metrics from 1970-2020 were examined to show farmland as a longer-term investment compared to a shorter time horizon of 2000-2020. See the figures below for full details.

Data maintained by the TIAA Center for Farmland Research.

The Promised Land OZ proxy demonstrated the highest risk-adjusted return compared to the other asset classes over both time periods.  PLOZ has the optimal position in the upper left-hand quadrant of the graph with a high return and overall lower risk compared to equities, REITS, and gold. Even in the last 20 years, the PLOZ proxy still yielded high, relative returns with lower risk.

The relationship between farmland and other investments can be further compared by examining the correlation of returns in the chart below.  A value of 1 means two asset classes are perfectly correlated and would be expected to move up or down in tandem.  A negative number suggests the two assets move in the opposite direction over time.

Promised Land’s negative correlation with stocks (S&P 500, Dow Jones, NYSE) gives reason to believe that farmland would provide diversification benefits and offset some of the volatility of these assets with high standard deviations (risk measure). In the more recent past (2000-2020), farmland’s negative relationship with stocks is even stronger with a -.32 correlation with the S&P 500. Note that when the S&P 500 dropped 48.6% in 2008 after the great recession, the Promised Land proxy maintained a positive return of 8.9%.

Relationship of Farmland with Inflation

Recently, investors have been concerned about inflation and how they will affect investment portfolios.  The Labor Department recently reported that inflation had hit a 31-year high in October with the consumer price index (CPI) rising to 6.2%. Investors and economists across the globe are wondering if we are witnessing the death of Fed’s “inflation is transitory” narrative.  Historically, stock indices have had a negative correlation with inflation and investors are concerned that these inflationary trends are long-term and secular in nature. Farmland on the other hand has historically provided a nice hedge against times of inflationary pressure. Examining the PLOZ proxy returns with CPI trends shows a positive correlation of .71, meaning historically an increase in the CPI will also increase returns to farmland. Recently this trend has held as some Midwest land is up 20% in value along with the higher consumer prices. See the figure below for more details.

Investment Opportunities

With its potential return and diversification benefits along with its track record as an inflationary hedge, farmland is positioned well to have a complimentary role in a traditional 60/40 (equity/bonds) investment portfolio. To optimize on this potential, investors have a few different options to partake in farmland investing. The most obvious option is to buy farmland directly.   However, this could be costly and comes with the requirement that the investor find capable management for the parcel. Buying a single parcel of farmland also puts the investor at more risk that comes from regional concerns like weather or farm-level (or idiosyncratic) risks like loss of production due to water or soil nutrient levels.

To alleviate some of the parcel management burden while still participate in farmland’s return and diversification benefits could be to invest in the Promised Land Opportunity Zone Fund. The fund is targeting internal rates of return between 8% and 14%, before consideration of the tax benefits it would provide to OZ investors. PLOZ’s mission is to help investors and agricultural communities achieve mutually beneficial outcomes through profitable, durable investing in farmland and the revitalization of rural American communities.  In addition to its core “opportunity zone” impact, Promised Land is evaluating other environmental, social, and governance (ESG) principles, such as farmland preservation, wetland and forestland restoration, organic conversions, and soil health and carbon management practices.  Promised Land’s vision is for these agricultural communities to prosper by feeding the world while OZ investors do well by doing good for these communities and the environment.  If you are interested in learning more about the Promised Land Opportunity Zone Fund, please contact Ethan Rhee at ethan@servantfinancial.com.

Another option for investors would be to invest in Promised Land’s partner: Farmland Partners Inc. Farmland Partners Inc. (FPI) is a publicly traded company that acquires and manages high quality farmland throughout North America. FPI manages the farmland in the Promised Land Opportunity Zone Fund as well. FPI’s current portfolio consists of 157,000 acres in 16 different states. Currently FPI’s stock is trading for just over $12 per share which is up 50% from this time last year. We believe this is an attractive entry point below the fair value of the farmland that FPI owns.   On their third quarter 2021 earnings call, CEO Paul Pittman, commented that the net asset value of the farmland was closer to $14-$15 per share. FPI has also restarted its growth and consolidation strategy.  In addition to direct farmland acquisitions, FPI is growing its asset management business with its property management arrangement with Promised Land and its recent acquisition of Murray Wise & Associates.

With the risk of secular inflation on the rise and the inherent portfolio diversification, an investment in farmland is something all investors should be considering. By including an allocation to farmland in your investment portfolio, you’ll have a much more efficient portfolio and be “one up on Main Street” investors enamored with a traditional 60/40 investment portfolio.

white-arrow