Email us at info@servantfinancial.com to talk to a financial advisor today!

Email us at info@servantfinancial.com

Jeromeggedon and Calamity Janet

“Guess what guys, it’s time to embrace the horror! Look, we’ve got front-row tickets to the end of the earth!” This month’s collapse of Silicon Valley Bank (SVB) had many of their well-heeled venture capitalist depositors and customers metaphorically reliving this scene from the 1998 movie, Armageddon. SVB’s downfall had people questioning if we are headed for another epic crisis in the banking system like that experienced in the 2008 Global Financial Crisis punctuated by the failure of Lehman Brothers. On March 8th, SVB announced a $1.8 billion loss on its investments in long-term treasuries prompted by depositors withdrawing funds. Withdrawals soon snowballed as general partners at venture-capital firms began pulling their money out of Silicon Valley Bank and urged their portfolio companies to do the same. Hours later, Moody’s downgraded SVB Financial triggering its stock price to crash sending shockwaves reverberating throughout the banking system. $52 billion in the market value of JP Morgan Chase, Bank of America, Wells Fargo, and Citigroup was lost as panic spread about the safety of banking deposits, particularly deposits over Federal Deposit Insurance Corporation (FDIC) insurance limits of $250,000. Two days after the initial announcement, the FDIC took control of SVB after depositors attempted to withdraw $42 billion. On March 12th, the New York Department of Financial Services regulators announced the 3rd largest bank failure, Signature Bank.  Signature Bank was one of the few banks accepting crypto deposits; some believe this made them an easy regulatory target. SVB’s failure prompted Signature Bank customers to move their depository funds to larger systemically important banks, like JP Morgan Chase and Citigroup, as concern rose surrounding its portfolio which was very similar to SVB’s.  Systemically important is the code for “too big to fail banks” that the Federal government will likely step in and save in a full-blown crisis.

Panic and concerns surrounding the U.S. banking system sent shockwaves from large banks down to your local community bank known for giving out lollipops for new deposits or transactions. $165 billion in losses of market value were experienced among the 10 biggest bank stocks and $108 billion in losses were incurred among small bank stocks according to the Federal Reserve. Concerns began to arise that we were in for another collapse of the banking system as the closure of SVB marked the 2nd largest bank collapse ever and the largest since the 2008 Global Financial Crisis.  Many experts wondered aloud whether SVB was analogous to a Lehman moment within the technology sector centered around Silicon Valley and San Francisco.

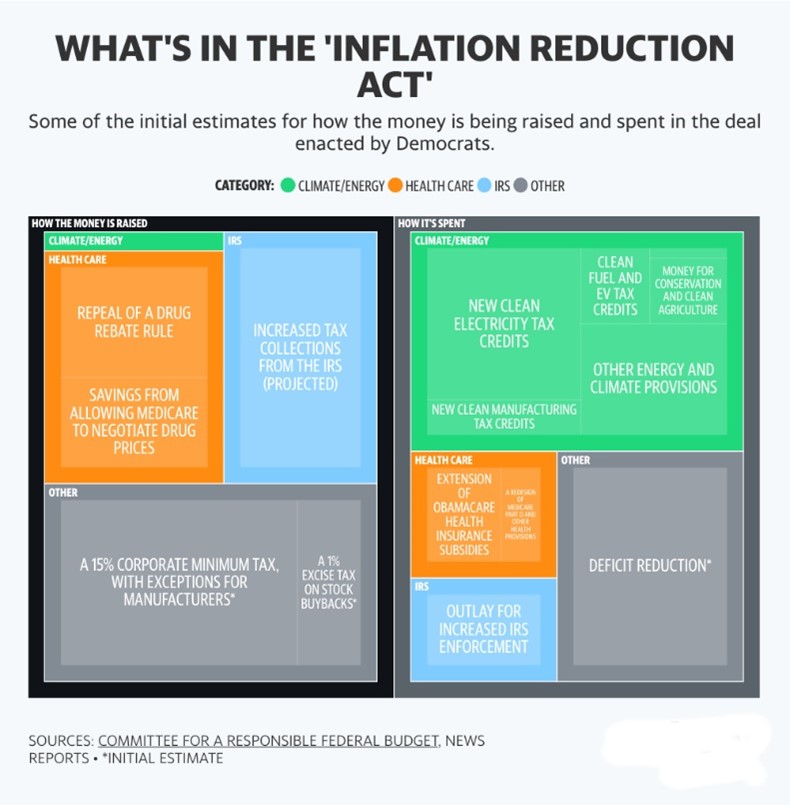
Image Source: Fox Business

The Downfall of Silicon Valley Bank

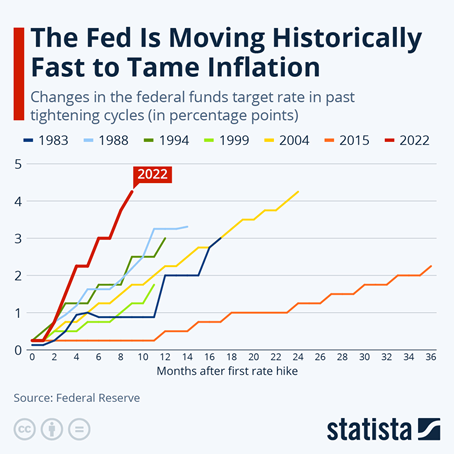
So where did SVB go wrong? As the name suggests, Silicon Valley Bank was a preferred bank for many tech start-ups and venture capital firms. The bank saw substantial growth during the pandemic as the technology sector was booming and venture capital money was raining down on VC startups, minting hundreds of Unicorns – VC startups valued at $1 billion or more. SVB invested the flood of deposit funds into treasury bonds, mortgage-backed bonds, and other long-dated assets which provided SVB with a larger interest spread over the interest SVB paid to its depositors in the low-interest rate environment during the pandemic. The Federal Reserve monetary and interest rate policy decisions and long-term guidance encouraged this behavior as Fed Chairman Powell labeled incipient inflation “transitory” in 2021.  But as inflation continued to rise into 2022, the Federal Reserve was ultimately forced to hike interest rates very aggressively.  The yield curve eventually inverted as long-term interest on 10-year treasuries fell below those offered on 2-year treasuries.  Consequently, the long-duration securities that SVB purchased to back its deposits fell substantially in value, something on the order of 25%. In accordance with accounting rules and the regulatory framework for banks, SVB had counted on the fact that they would hold their investments until maturity and did not recognize the mark to market impact of higher interest rates in its financial statements.  These held-to-maturity securities were carried at cost on their balance sheet until they could no longer be “held.”  Sophisticated depositors caught wind of this shadow accounting issue with SVB’s announcement of a $2 billion equity capital raise.  Deposits were rapidly withdrawn causing a forced sale of these long-term securities and creating large realized losses.

SVB had also been facing a general slowdown in the venture capital funding cycle and deposit taking. Venture capital investments are far less attractive when the cost of capital rises with interest rates.  It’s far easier to finance these ventures that do not cash flow for several years, maybe a decade or more, at zero interest rates, but it’s a completely different ballgame with the Federal Funds Rate at 5.0%. Funding across the venture capital space slowed meaningfully and deposits to the preferred depository institution began to shrink massively.  Moreover, these cashflow-burning startup enterprises continued to rapidly withdraw money for payroll and operational expenses. The Federal Reserve’s wild misjudgment on inflation and subsequent unprecedented rapid hiking campaign fomented the destructive conditions for a life-or-death decision between the safety of deposits and SVB’s insolvency, or Jeromeggeden.   The Federal Reserve had effectively financially engineered this textbook run on Silicon Valley Bank by its policies. Many sophisticated investors had long ago concluded that the Fed would keep hiking interest rates until they broke something. Technology-sector concentrated SVB proved to be the weak link and the first domino to fall.

The big question is how many other banks will be caught swimming naked on interest rate risk management now that the banking deposit tide is going out. This banking cycle is a foreseeable consequence of Fed monetary policies. Remember under quantitative easing (QE), the Federal Reserve printed dollar reserves and used those reserves to take U.S. treasuries and other government-backed securities out of private hands. These excess reserves generated by QE are now trapped in the U.S. banking system. Depositors are being rational economic actors and withdrawing bank deposits and buying money market funds that hold U.S. treasuries.  With money market funds yielding 4.3% today, this deposit withdrawal cycle may be largely irreversible.  The Fed should be accelerating its wind-down of its U.S. treasury holdings to soak up the wave of private demand for treasuries.

The Federal Reserve’s Response

The fears around the financial stability of the banking system had investors and consumers alike calling for a slowing of Federal interest rate hikes. Investors and banks alike had already been questioning Chairman Jerome Powell on the timing (too late to start the hiking cycle) and pace (too fast hiking because playing catchup) of their policy decisions. Judgment day came on March 22nd when the Fed announced another 0.25% rate increase making it clear their priority was combating inflation despite growing fears about the stability of the banking system. The rate hike prompted banks to lose further equity value both domestically and in Europe, causing unease that the Fed’s decision could cause additional damage to the already wounded banking system. Mr. Powell said that “depositors should assume that their deposits are safe” as the government plans to impose further regulations on an already heavily regulated industry. This “watch and see what happens” approach was small comfort and hasn’t given bank depositors in non-systematically important banks that warm and fuzzy feeling about the safety of their deposits. Deposit withdrawals at regional and small community banks continued apace.

Will the Large Banks Keep Getting Larger?

The resulting crisis has depositors and banks alike looking to the FDIC and U.S. Treasury Secretary, Janet Yellen for guidance. Yellen commented at a Capitol Hill hearing that the FDIC will cover the uninsured deposits (excess of $250,000) of both SVB and Signature bank, yet there is great uncertainty if this policy decision would apply to other bank depositors in the future. Yellen publicly said shortly after the SVB collapse that the FDIC could cover depositors whose funds exceed the $250,000 limit.  However, when questioned if all banks would receive this treatment at the Congressional hearings, Yellen’s response appeared to suggest that small and midsized banks would be left out. The calamity caused by Yellen’s comments was highly disruptive for many smaller banks as it prompted businesses and individuals to contact their local community banks about transferring their depository funds to larger banks that Yellen said would be protected.  This was a surprisingly dismal show of confidence from the U.S. Treasury Secretary who once proclaimed in 2017 as Fed Chairman “I don’t see a financial crisis occurring in our lifetimes.”

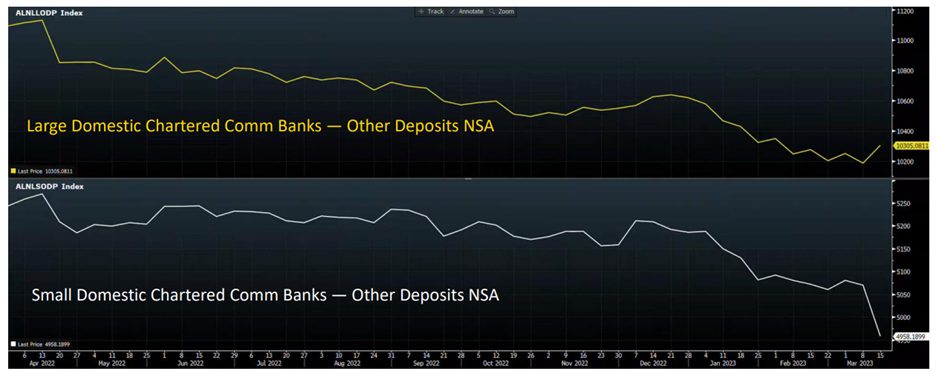
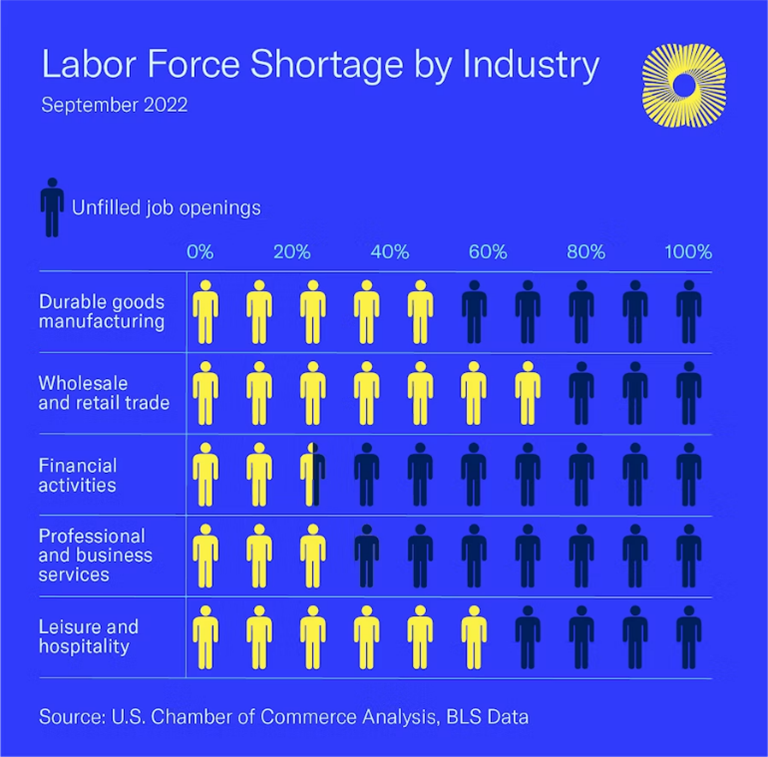
From March 8th to March 15th, $110 billion flowed out of small banks into larger banks. Small banks account for just 34% of deposits in the U.S. banking system; however, they account for a substantial portion of commercial real estate loans sitting at 74% of total loan activity. Like the iconic Bailey Building and Loan from It’s a Wonderful Life,  these small community banks lend out deposit funds to Main Street America borrowers for local commercial real estate projects or businesses. If deposits to small banking institutions continue to contract, then this would reduce capital available for commercial real estate lending. Small banks often work with borrowers whose needs are more specialized or whose funding needs are too small in size for the larger banks in America to consider. For example, according to the American Banking Association, a majority of agricultural lending is done by small and mid-sized banks that have deep roots in their rural communities. Farm loans require specialized analysis and training that not many large banks possess. If depositors pull their money from these small institutions, this could affect the availability of capital for agricultural lending, small business lending, and lending to underserved/underbanked communities.

While concerns surrounding the U.S. banking system have merit, the situation Silicon Valley Bank found itself in was somewhat unique. Nationwide, 45% of all deposits in the United States banks are uninsured; however, at SVB almost 94% of their deposits were uninsured. To stem this evolving bank liquidity crisis, the Fed created a new program to administer additional funding called the “Bank Term Funding Program,” (BTFP). Through this program, banks would be loaned funds if they pledge U.S. Treasury securities, mortgage backed securities, and other collateral. The result would be potentially transferring the risk of bank losses from the bank to the federal government. Through BTFP, the Federal Reserve apparently will provide liquidity to the borrowing bank may give loans based on the par value/cost of the securities rather than its depreciated market value.  In other words, they moved the shadow accounting for unrealized losses to the Fed’s balance sheet.

Safety of the US Banking System

Despite ongoing concerns surrounding the stability of the U.S. Banking system and another potential banking crisis similar to 2008, most economists believe that the U.S. Banking system is sound. On a broad scale, U.S. Banks are solvent overall and are not at a high risk of systematic failure or collapse. While rapid interest rate hikes have caused more severe fluctuations in capital flows in higher interest rate sensitive sectors of the economy, like technology and banks concentrated on that sector, we would expect that most large banks have well-risk-managed investment and lending portfolios and show more of diverse depositor base among sectors. Silicon Valley Bank appears to be a unique case of a large bank that did not properly manage the interest rate or duration risk of its investment holdings and Federal regulators were found asleep on the job again. Small community or regional banks may struggle to diversify their portfolio from a geographic standpoint however their focus gives them the ability to lend to a wide array of small businesses such as farms, retail, commercial property, and others. The investment portfolio of these smaller banks is closely watched by bank regulators as they serve such a large percentage of the total loan volume.

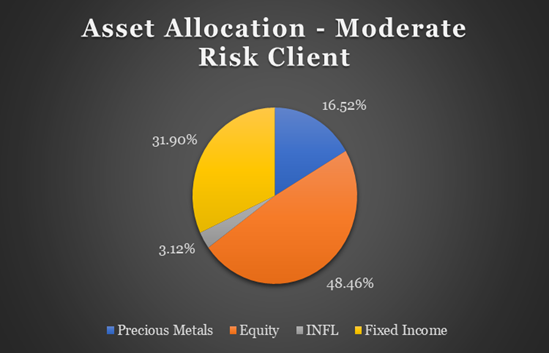
Policy actions and statements from the Fed’s Jeromeggedon and Treasury’s Calamity Janet have many Wall Street economists forecasting the U.S. will be in a full-blown recession by the second half of 2023, potentially forcing the Fed to pivot and begin lowering interest rates. Servant Financial client portfolios continue to stay overweight cash and fixed-income securities relative to strategic risk targets. The Federal Open Market Committee’s (FOMC) decision to raise the Fed funds rate by 25 basis points last week shows that the Fed is prioritizing its “stable prices” mandate over financial stability. We believe this policy decision will ultimately lead to increased financial instability while heightening inflation risk.  As such, we are maintaining underweights to equity and credit risk and healthy portfolio allocations to precious metals and other real assets.

Based on the FOMC’s subsequent actions, we plan on adjusting risk allocations once financial instability and recession risks have been fully repriced.  We expect the Fed will be forced to abandon its inflation fight and lower interest rates materially in the coming quarters. For now, we are advising clients to remain the rational actors that all economists expect us to be. For our portion, that means getting paid to wait by holding excess cash in money market funds with better yields from short-term investment-grade bonds. For example, the Fidelity Government Cash Reserve money market fund (FDRXX) yields 4.3% as compared to just 0.7% more in yield (5.0%) for a high-quality bond fund with a 6-year duration.  This short-term positioning greatly reduces the risk of taking a wait-and-see approach to the rapidly evolving macro, policy, and market backdrop.

Keep it simple with money market funds for your liquid savings as well or keep it local if you can.   Consider maintaining savings accounts or bank certificates of deposit (CDs) of 6 to 12 months at multiple local banks in support of your community. CDs, like checking or savings deposits, are only FDIC-insured up to $250,000 but are now offering rates from 4% to 5%. Ultimately, it is important to do business with people you trust and places you know will be there when you need them. Have conversations with your local banker to find out how protected your money is. Shop around, this is a saver’s dream after nearly a decade of near-zero interest rates.

Disclaimer: This is not investment advice and should not be used in the context of forming an investment portfolio. See your investment advisor or talk with Servant Financial today about how these factors affect your portfolio.


Twelve Themes of Christmas

Contributions made by: John Heneghan & Michael Zhao


‘Twas the week before Christmas, when all through the financial house, not an investor was resting, not even a DC louse. 2022 brought investors increased market volatility and a wide array of risks and uncertainties remain, yet some opportunities may lie hidden under the Christmas tree. From inflation worries to geopolitical risks, we have been on a wild sleigh ride this past year. But whether you landed on the naughty or nice list this year depended on your ability to navigate the economic whiteouts caused by the likes of the Federal Reserve, Vladimir Putin, and Sam Bankman-Fried.


Tis’ the Season for Interest Rate Hikes

On the first day of Christmas, Federal Reserve Chairman stuffed my stocking with 7 rapid interest rate hikes. The Fed has been hiking the benchmark Federal Funds Rate at an unprecedented pace to combat high inflation which is causing concern among investors and consumers alike. As the cost of borrowing increases, whether it’s for a mortgage, car loan, or credit card, it impacts the affordability of goods and services for many households.  People tend to hunker down on spending and are less likely to take on new debt, which impacts aggregate consumer spending and business investment. Recently, the Federal Reserve raised its benchmark interest rate from 4.25% to 4.5% in its final policy meeting of the year. This marks the seventh consecutive increase in just nine months to the highest benchmark interest rate in 15 years.

The Federal Reserve has signaled its desire to keep interest rates higher through 2023 with the potential of rate easing, not until 2024. As a result of the Fed interest rate hikes, mortgage rates have reached 20-year highs, interest rates for home equity lines of credit are at 14-year highs, and car loan rates are at 11-year highs. Savers, on the other hand, are seeing the best bank deposit and bond yields since 2008. The 10-year U.S. Treasury yield hit a 12-year high in September at 3.93% causing foreign investment to flock to U.S. treasuries and spurring strength in the U.S. Dollar. After several years of low-yielding bond investments, investors are busily re-balancing their investment portfolios so they can much more safely jingle their way to their investment objectives.

Source: Statista


Dashing through Inflation

Santa’s pocketbook may be feeling a bit squeezed this gift-giving season as inflation continues to rage at the North Pole, particularly for the basic foodstuffs like milk and cookies. The Bureau of Labor Statistics reported earlier this month that the U.S. Consumer Price Index (CPI) saw a 7.1% increase year over year during the month of November, down from annual CPI of 7.7% in October and lower than the 7.3% increase forecast by economists. Importantly, the November monthly increase slowed to 0.1% and was driven into positive territory primarily by rising food (0.5%) and housing costs (0.6%). The PCE Prices Index due this Friday is the last consequential data release for the year. Other data this week mostly focuses on the housing market where home sales have slowed down, but actual prices continue to rise. Still rising housing costs are a problem for the Federal Reserve as “shelter” expenses account for the largest share of CPI. Housing cost increases have been slowing down and many economists believe gauges for both home prices and rents will start to show declines in the coming months.  The Fed’s owner’s equivalent rent measurement is a notorious lagging factor and when this statistic rolls over it may take a substantial bite out of headline inflation.  Supply chain backlogs, rising costs, government spending, labor shortages, and increasing demand have all played a part in elevating inflation to its current levels. As a result, these inflation trends have been the principal driver of the Federal Reserve’s aggressive hiking policy which has economists, investors, and consumers appropriately worried that a Fed-induced recessionary winter storm might be brewing as the Fed overshoots on the hawkish side.


Baby, it’s Looking like a Recession

Current economic pressure really can’t stay, baby, it’s looking like a recession. Recession fears are rising as investors lose confidence in U.S. economic performance in the face of an unprecedentedly rapid and yet unfinished Fed hiking cycle. Despite relatively strong economic growth in the third quarter of 2022 and a still low unemployment rate of 3.7%, the Federal Reserve has lowered its forecast for next year’s U.S. economic growth in light of its rate hikes and expects the unemployment rate to rise by the end of 2023 as well. Some believe that the current widespread concerns about a recession may help us avoid one, as caution leads to less risk-taking and borrowing, potentially cooling the economy enough to reduce inflation and the need for further interest rate hikes. Lagging inflation statistics remain elevated and central banks globally are continuing to raise interest rates to destroy demand and slow economic growth in the coming year. More real-time inflation measures, like the Cleveland Fed’s “Inflation Nowcasting” measure, show inflation moderating. Inflation Nowcasting’s fourth quarter run-rate CPI is at 3.5% and Core CPI (excluding food and energy) is at 4.7% suggesting the Fed is “fighting the last war” rather than anticipating what will happen next.


The U.S. Dollar All the Way

Santa’s reindeer are taking a new launch angle this year along with the U.S. dollar by soaring to new heights in 2022. The US Dollar Index, a measure of the dollar against a basket of other major global currencies, had been on the rise throughout 2022 but started to taper off in late November and December. Other central banks have joined the competitive rate-hiking game and compressed interest rate differentials. The strong dollar is beneficial for American consumers who purchase foreign goods, as it makes them cheaper in U.S. dollar terms. However, it can be an earnings headwind for American businesses that export goods or have multinational business operations such as McDonald’s and Apple. McDonald’s reported that its global revenue fell 3% this past summer due to the strong dollar as the rising costs of Big Macs have foreign consumers turning to other options. The strong dollar is also a reflection of the relative strength of the U.S. economy compared to other advanced economies, such as those in Europe (Euro) and Japan (Yen). Foreign investors flocking to higher and arguably lower-risk U.S. treasury yields only bolsters the dollar further.

U.S. Dollar Index; Source: Google Finance

Eat, Drink, & Spend like Consumers

U.S. consumers found themselves on the nice list in this year of profligate government spending. The US government gave consumers several nice stimulus checks due to the COVID-19 pandemic.  While some consumers used these relief funds to pay for day-to-day necessities, others have been able to enjoy new furniture, electronics, and vacations that have them saying “Mele Kalikimaka”.  Economists predict this holiday season may be the last fling of spending toward luxury brands and exotic travel. The current level of consumer spending is projected to dwindle towards the end of next year as recessionary fears manifest and unemployment levels grow as the Fed’s aggressive hiking policy takes hold.


It’s Beginning to Look a lot like a Labor Shortage

Santa may be having a bit of trouble finding enough elves to manufacture toys in his workshop this year. The COVID-19 pandemic brought about many changes to people’s lifestyles, and many re-evaluated their lifestyles as they were challenged with their mortality. Across the nation businesses in every sector are feeling the pressure to find enough skilled labor to meet the growing consumer demand for goods and services. In 2021, 47 million workers quit their jobs in what is referred to as the “Great Resignation.” The industries hurting the most are food services, manufacturing, & hospitality. Workers have signaled a desire for better company culture, work-life balance, and compensation. Some believe the labor shortage will work itself out if a recession were to occur.   However, others argue that this is just the beginning of secular labor shortages as declining birth rates in the U.S. and other developed nations have economists worried that we are not restocking the world’s workforce fast enough. Maybe Santa will be nice enough to supply us with some of his highly productive elves to bridge this gap until intelligent robotics develop further.

Source: US Chamber of Commerce


How Vladimir Putin Stole Ukraine

At the top of most of the world’s Christmas wish list is for the Russian-Ukrainian conflict to be resolved. Not only did the invasion of Ukraine in February bring about economic disruption but it has brought devastation to the Ukrainian and Russian people. It is estimated that close to 7,000 civilians in Ukraine have lost their lives in the conflict. The power-hungry, Russian Grinch Putin, is committed to overtaking Ukraine for strategic access to important trade routes and resources. Currently, Russia is occupying several major port areas along the Black Sea.  The Ukrainian defense has been putting up a strong fight with the help of $32 billion and growing of financial support from U.S. taxpayers.  Several trade restrictions and sanctions have been put into place to hurt Russia financially.  However, since Russia is the global largest energy supplier of natural gas and oil, these sanctions are only putting more extreme pressure on energy prices worldwide. Ukraine is also a large exporter of agricultural products, and the conflict has caused several production and logistics issues for Ukrainian farmers. Commodity prices have climbed as a result, particularly for wheat. While the conflict today looks unresolvable, maybe Grinch Putin’s heart will grow three sizes and he’ll decide to shower Who-ville with presents instead of artillery.  “Fahoo fores dahoo dores!”

Photo Source: Behance

Source: Wikipedia


Making Energy Bills Bright

As the war between Russia and Ukraine rages on, energy bills for people around the world continue to climb. Oil and natural gas prices have soared in 2022 with Europe being hit hardest by the jump given its deep dependence on Russian natural gas. In August, gas futures hit a record high of 350 euros creating immense pressure for European nations to set price limits on natural gas. Household electricity prices from natural gas-fired plants have increased in Europe by 67% in just one year, stopping some Europeans from lighting their Christmas trees this year. The European energy ministers imposed an electricity price cap this week to help lessen the burden on consumers. The United States has also felt the brunt of high energy prices as power prices rose almost 16%, the highest increase in 41 years. Consumers also felt the pressure at the gas pump as the average price of a gallon of gas rose to $4.96. Maybe in 2023, we can be like Santa and his reindeer-powered business model by running more of our economy on renewable energy.


Cryptocurrencies Roasting on an Open Fire

Cryptocurrencies roasting on an open fire, Sam Bankman-Fried nipping at your confidence. One of the largest cryptocurrency exchanges and hedge funds, FTX, filed for bankruptcy this November after information was released about its risky holdings and clandestine relationship with its affiliated hedge fund Alameda Research spooked many of its exchange customers. Several exchange customers sought to withdraw their crypto holdings from the FTX exchange, prompting the bankruptcy filing of the company.  It turns out FTX was another Ponzi scheme or con game with apparently none of FTX’s well-healed venture capital investors doing any due diligence or demanding a role in corporate governance. The price of Bitcoin has fallen 65% in the past year with investors losing confidence in an asset class imputatively regulated by the SEC and Commodities Futures Trading Commission (CFTC).  The CFTC has defined bitcoin as a commodity, but a turf war has continued with SEC creating regulatory uncertainty and ample opportunities for miscreants.  FTX was a Bermuda-based firm regulated by the Securities Commission of the Bahamas.  The SEC could have required crypto exchange registration and reporting and U.S. domestic incorporation.   Former FTX CEO, Sam Bankman-Fried, has agreed to extradition and will now be answering to the Justice Department and SEC for violations of wire fraud, money laundering, securities fraud, commodities fraud, and conspiracy to violate campaign finance laws. The once shiny wrapped package that was FTX Digital Markets now looks like a lump of coal.  Expect the naming rights for FTX Arena, home of the Miami Heat, to become available soon and most of FTX’s liberal political contributions to be returned to the bankruptcy court. Bernie Madoff will look like a petty thief compared to SBF.


Dreaming of Student Loan Forgiveness

About 43 million Americans received a nice Christmas present from President Biden this year, with forgiveness for part of their $1.6 trillion student loan debt. President Biden announced the plan earlier this year sparking both joy for recipients and scrutiny from every other U.S. citizen. The plan would eliminate $10,000 in federal loans for individual borrowers making less than $125,000 per year or couples earning less than $250,000 annually. Pell Grant recipients, which account for 60% of current student debt holders, could receive upwards of $20,000 in forgiveness. However, this largesse begs the question of where the money for this forgiveness will come from as the US government already is $31 trillion in debt.  Biden’s Executive Order faces many legal challenges in Congress and the Supreme Court to overcome and move this profligate effort forward.


All I Want for Christmas is Farmland

The bright star on top of the investment tree this year is an asset class that has been at the top of many institutional investors’ Christmas wish lists all year, U.S. farmland. Farmland hasn’t always been seen as an accessible investment option.  However, farmland funds such as Promised Land Opportunity Zone Fund and others have been formed to allow investors access to in this durable, inflation-beneficiary asset class. Iowa State University recently reported farmland values in Iowa were up 17% in 2022 which comes on top of a 29% increase in 2021. Similar stories have been reported throughout the Midwest as strong commodity prices fuel farm incomes and transacted land values. The COVID-19 pandemic had people re-evaluating what is important to our world with basic human needs, like food, at the top of the list. While consumer preferences and social trends may change, people will still need to eat, making farmland one of the most durable asset classes through time. This has many investors saying “All I Want for Christmas is Farmland.”


We Wish You a Diversified Portfolio

At Servant Financial, our goal is to help you navigate these turbulent times and help you make the best decisions for your investment portfolio. We understand increased market volatility may be causing investor unease, but it is times like these that the basic investment principle of portfolio diversification proves its mettle.  With inflation still a concern and US treasuries on the rise, we are paying close attention to iShares 0–5-year TIPS Bond ETF, STIP. With low management fees (.03%) and a 30-day SEC yield of 5.84%, its 2.5-year duration could be an ideal addition to a blended debt and equity portfolio.  The principal value of TIPS (upon which the stated interest is paid) is adjusted semiannually as inflation rises, as measured by CPI.  STIP holds a variety of U.S. treasuries with maturities of less than 5 years protecting you against rising interest rates and inflation.  STIP is a core holding of Servant’s risk-based client portfolios.


Happy Holiday’s from your friends at Servant Financial and we wish you a globally diversified portfolio.  

Instead of holiday cards or gifts, Servant Financial will be making an annual contribution on behalf of clients and friends to Mercy Home for Boys & Girls.

May this holiday season be a time of rich blessings for you and your family.

Source: Pinterest

Wild Turkey Inflation Run

Equity and bond market investors have a very busy week ahead of them after giving thanks with friends and family this past week.  The Federal Reserve also has its work cut out for them on the inflation front.  Unfortunately, a lackadaisical Fed Reserve has let inflation go on a wild turkey run. The latest Consumer Price Index (CPI) reading for October 2022 came in at a roasting annual increase of 7.7%.  As usual whenever inflation is an issue, it’s typically driven largely by the necessities of human existence.  Energy prices increased most of the CPI measurements at 17.6% followed by food increases of 10.9%.

According to the University of Illinois, 46 million turkeys are eaten each Thanksgiving.  The American Farm Bureau Federation estimated that the average cost of this year’s Thanksgiving holiday meal for ten people increased 20% to $64.05 from the 2021 average of $53.31. America’s collective Thanksgiving spending increased more than $225 million for just the turkey and not counting side dishes (46 million times $4.97 AFB price increase for turkey). U.S. Secretary of Agriculture Tom Vilsack had previously warned all Americans of a large turkey shortage. Free-market Austrian economists chortled that Secretary Vilsack had neglected to count the docile turkeys at the Federal Reserve and in leadership in the executive and legislative branches of the Federal government.

All kidding continued, let’s talk turkey about inflation. The greatest economic uncertainty and focus for investors seems to be whether the Federal Reserve gaggle is succeeding in reining in inflation or not. Stock market bulls are feeling a little more confident that the Federal Reserve is moving closer to ending its tightening program after “minutes” from the November policy meeting showed “most” of the Fed herd favored slowing the pace of interest rate hikes “soon.” According to the Fed minutes, some turkeys even warned that continued rapid monetary policy tightening increased the risk of instability or dislocations in the financial system.

Most Wall Street experts predict the central bank clucks will raise the benchmark rate by 50-basis points at its upcoming December 13-14 meeting following four consecutive 75-basis point hikes. The most important inflation updates this coming week will be the PCI Prices Index on Thursday and the November Employment Situation on Friday. Investors are also anxious to hear Top Cockster Jerome Powell discuss the US economic outlook during an appearance at the Brookings Institute on Wednesday afternoon. Powell recently crowed that the Fed could shift to smaller rate hikes next month, but, like all two-handed economists, also squawked that rates may need to go higher than policymakers thought would be needed by next year. Stock market bears maintain that the more important issue is how high rates will ultimately need to go and how long the Fed will hold them there.  All of which is of course dependent on how fast inflation comes down. This is the key question being debated among economists, business leaders, investment advisors, and investors.

For their part, the Fed members generally see inflation coming home to roost rather quickly.  The range of Fed member projections from their last dot plot exercise in September, 2022 are as follows – 2022 (5.0% to 6.2%), 2023 (2.4% to 4.1%), and 2024 (2.0% to 3.0%).  This Federal Reserve has lost an incredible amount of market credibility by being stubbornly beholden to its “inflation is transitory” mantra in 2021. It’s prudent for all economic actors, particularly low- and middle-income consumers and workers who arguably suffer the greatest hardships during inflationary periods, to at least consider that the turkeys at the Fed are once again being too optimistic on inflationary trends.  If the moral sense of the global working-class population is that inflation is a secular trend, it may likely become a secular trend. Look for striking workers and protesting citizenry in the U.S. and globally.

I believe it was Founding Father Patrick Henry of “Give me liberty or give me death!” fame that also counseled, “I have but one lamp by which my feet are guided, and that is the lamp of experience.  I know no way of judging the future but by the past.”  Thankfully, the investment professionals at Research Affiliates (RA) have examined inflationary eras of the past in their recent article, “History Lessons: How “Transitory” Is Inflation?” RA examined a meta-analysis of 67 published studies on global inflation and monetary policies.  Their key conclusions from their study were as follows:

  • The US Federal Reserve Bank’s expectation for the speed of reverting to 2% inflation levels remains dangerously optimistic.
  • An inflation jump to 4% is often temporary, but when inflation crosses 8%, it proceeds to higher levels over 70% of the time.
  • Reverting to 3% inflation, which we view as the upper bound for benign inflation, is easy from 4%, hard from 6%, and very hard from 8% or more. Above 8%, reverting to 3% usually takes 6 to 20 years, with the median of over 10 years.
  • Those who expect inflation to fall rapidly in the coming year may well be correct. But history suggests that’s a “best quintile” outcome. Few acknowledge the “worst quintile” possibility in which inflation remains elevated for a decade. Our work suggests that both tails are equally likely, at about 20% odds for each.

As Fed Chair Jerome Powell remembers well because he lived it, the last secular inflationary episode in the United States was in the 1970s and 1980s.  If Shakespeare is right that “What’s past is prologue,” here is a summary of the return performance of various major asset classes in the 20-year inflationary period from 1970 (CPI breached 6% in 1969) to 1986 (CPI declines to 1%) to illuminate the darkness of an unknown investment future.

Source: Data complementary of the TIAA Center for Farmland Research

The best risk-adjusted return profiles from this secular inflationary period were high quality fixed income instruments of varying maturities and farmland. Note that farmland and bonds were negatively correlated over this period so may complement each other rather nicely in a portfolio positioned for secular inflation.  REITs and gold provided similar annual returns but at much higher levels of volatility/standard deviation.

In bowling, three strikes in a row is called a turkey. In economic parlance, that’s the triptophanic effect of the sleepy leadership at the Federal Reserve and in the executive and legislative branches of the Federal government.

Don’t Judge A Book By Its Cover

Goals of the Inflation Reduction Act

The Inflation Reduction Act of 2022 was officially signed into law by President Biden this month. While the name gives the impression that the bill is narrowly focused on inflation, in reality the bill is a complicated 730 page document of objectives and regulations covering a variety of issues. Most notably, the bill includes historic investments in energy and climate reform spanning a  ten year period. While the bill itself is long and complicated, the overall goals and methods are easily identifiable.

Broadly, the key focuses of the Inflation Reduction Act are increasing taxation and enforcement of taxation for wealthy corporations and individuals, climate and energy reform, and improving health-care programs to increase coverage and lower prices of certain drugs. The last focus is where the bill receives its namesake, to fight historical inflationary levels. However, inflation reduction measures only receive a small fraction of the allocated spending. Of the areas of spending, climate and clean energy receive the largest investment with a historic $379 billion investment. All of these key areas of focus could warrant further examination given the complexity and depth of each of the issues. However, for the sake of viewing this subject through an investment lens, we will briefly highlight the biggest areas of legislative change. We will then examine climate and clean energy reform specifically as this area receives the most funding and creates the most investment opportunities.

What does the IRA do?

The major source of funding for spending and investment in the Inflation Reduction Act comes from the tax reform aspects in the bill. The most significant of these being a minimum 15% corporate tax for enterprises with adjusted income exceeding $1 billion. According to summary documents on the tax effects of the Inflation Reduction Act, “up to 125 corporations that average nearly $9 billion in profit paid effective tax rates of 1%”. This provision alone will generate an estimated $313 billion over the life of the bill. In addition to this, the bill implements a 1% stock buyback fee or tax. In addition, the bill includes improved funding for the IRS to improve collection and increase the number of audits for individuals with annual income exceeding $400,000. These and other smaller changes are expected to generate a total of $468 billion in revenue for the bill.

The next area of focus for the Inflation Reduction Act is health care reform. The health care provisions include large investments but also generate substantial funds. Some of the key changes made include a) empowering Medicare to negotiate prices of certain medications, b) capping Medicare patients out of pocket payments to $2,000 a year, c) extending Affordable Care Act subsidies for three years, and d) establishing better controls over pharmaceutical companies’ medication price increases. These and other lesser changes made in the health care sections will save an estimated $322 billion of revenues and only require $98 billion of spending.

While the name of the Inflation Reduction Act would likely lead you to believe reducing inflation would be the main focus of the bill, many economists are skeptical that inflation will be reduced at all. According to a study from the Penn Wharton Budget Model, “the impact on inflation is statistically indistinguishable from zero” over the life of the bill. The bill is essentially designed to raise necessary funding through tax reform and healthcare savings and invest those funds into the Administration’s spending priorities in healthcare and climate reform. Any remaining funds are put towards reducing the U.S. budget deficit. While the Biden administration has claimed the Inflation Reduction Act will counter inflation through deficit reduction and fiscal policy with the 15% minimum tax rate, economists believe these methods are unlikely to have much, if any, effect. The estimated $300+ billion that will be put towards deficit reduction wouldn’t even cover the $400 billion deficit we have accumulated this year alone, not to mention the additional government deficits that will accumulate by the end of the bill’s life. Additionally, some economists disagree with the idea that deficit reduction has any effect on reducing inflation at all. Under our current system, the only real way to control inflation is through the Federal Reserve raising interest rates to control the quantity of money in the money supply. Unfortunately this is not something that can be accomplished overnight. For average Americans, most, if any, inflation reduction will be seen through slightly reduced energy prices from policy reforms and investments made in energy and climate change.

Climate and Clean Energy Reform

The largest focus of the Inflation Reduction Act is the reform and investment in our climate and energy sectors. As mentioned above, the bill allocates $387 billion of the total $485 billion of total funding for a variety of energy and climate-related improvements. This section of the Inflation Reduction Act has four core goals: 1) Lowering consumer energy costs by providing $9 billion in home energy rebate programs, ten years of consumer tax credits to make homes more energy efficient, additional tax credits for the purchase of electric vehicles, and other smaller things to lower consumer energy costs. 2) Improving American energy security and increasing domestic manufacturing by administering $30 billion in production tax credits for manufacturers creating clean energy tech. Grants and loans will also be administered to convert existing auto-manufacturers to electric vehicle production or building of new facilities as well as any other smaller incentives to increase U.S. production of clean energy technologies. 3) Decarbonize our economy by providing incentives in the form of grants, loans, and tax credits to improve our clean energy production and consumption, as well as other programs to reduce industrial emissions. 4) Investing in conservation, infrastructure, and rural development through investments in climate-smart agriculture, infrastructure projects to support rising demand for electricity and reduction in carbon emissions by roughly 40% by 2030, and other miscellaneous programs to improve conservation efforts. This historic investment in climate and clean energy improvements will likely create great investment opportunities in the next decade.

Opportunity to Invest?

Like many technological advancements in the past two decades, many renewable energy sources have gone from fringe and somewhat inefficient technologies to being extremely desirable and widely adopted. Since 2000, U.S. renewable energy sources have increased by 90%. This market has appeared to be a sound investment for many years now. With all of the incentives for advancement and increased adoption of these technologies from the Inflation Reduction Act, there has never been a more attractive time to invest in renewable and clean energy markets. For our purposes, we have our eyes on two exchange-traded funds(ETFs) in the clean energy and renewables space.

The first opportunity is iShares Global Clean Energy ETF (ticker: ICLN), one of the leading clean energy ETFs holding a portfolio of the industry’s top performing companies. Currently, ICLN holds over $5.5 billion in assets under management and is one of the most popular clean energy ETFs with an average trading volume of around 3.8 million. The second ETF we are watching is the First Trust NASDAQ Clean Edge Green Energy Index Fund (ticker: QCLN). QCLN, another of the more popular clean energy ETFs, holds over $2.35 billion in assets under management with a similar portfolio of top-performing stocks in the clean energy market but with a lower average trading volume of 309,670. Both of these opportunities have historically performed well over the long term. QCLN has been riskier, returning 22.7% per year over the last 10 years through July 31, 2022 and (8.3%) year-to-date compared to 15.9% annualized ten year return and 6.0% year-to-date for ICLN. QCLN’s 8% allocation to Tesla, Inc. (TSLA) might have something to do with its higher volatility. Given the significant investments that will be made in the clean energy and renewables market through the Inflation Reduction Act, this strong performance will likely continue.

In conclusion, the Inflation Reduction Act makes historic improvements to many different areas unrelated to current inflationary trends. Most significantly, the bill will incentivize the transition to a “greener” future as well as improve healthcare for millions of Americans by raising taxes and closing “loopholes” for certain profitable, yet low-tax corporations. The jury is still out on whether this act will successfully achieve its cover story of combatting inflation. However, fiscal policy reforms and deficit reduction efforts will at least ease the load on the Federal Reserve monetary policy somewhat.

The Rollercoaster Market

Disclosure: This is not investment advice. Consult your investment advisor to make decisions appropriate for your portfolio and life circumstances.

Current Status of Financial Markets

Financial markets have twisted and turned throughout much of 2022 as investors react to inflation, interest rate hikes, and looming concerns from the COVID-19 pandemic. The year-to-date graphs of market indices mimic a rollercoaster heading down a sharp drop before leveling off prior to its next unknown feature – steep ascension, another drop, or into a nauseating barrel roll.  See Figure 1. Ironically, the oldest roller coasters are believed to have been the Russian Mountains, specially constructed ice hills located in St. Petersburg. As in any time in financial history, there are a variety of interlocking factors impacting markets and bringing about recessionary fears. Current circumstances may drive some investors to get off this rollercoaster market, but more seasoned investors will understand the importance of sticking to the long-term plan and riding out the volatility.

Figure 1: Market Indices Performance Year-to-Date

Source: Wall Street Journal

In February, we discussed the impact rising inflation was having on the global economy and since then inflation pressures have remained high. The U.S. annual inflation rate slowed slightly in April to 8.3% from 8.5% in March with the largest inflationary pressure stemming from the energy and food sectors. That comes as no surprise considering the U.S. average gas price is at $4.60/gallon, up from $3.04/gallon just one year ago. Escalating inflation prompted the Federal Reserve to adjust its monetary policy by raising interest rates 0.50% on May 4th, the biggest increase in two decades. Based on Fed Chairman Jerome Powell’s remarks after the decision, more 50-basis point rate hikes should be expected to curb inflation. The Federal Reserve’s policy actions prompted 30-year fixed-rate mortgages to rise to 5.27% on May 5th.   Home sales are starting to slow as financing becomes more expensive and house ownership less affordable for consumers. Americans are beginning to wonder if there is an end in sight to rising costs and fluctuating financial markets.

Another factor causing inflationary pressure for consumers is ongoing supply chain issues. It has been more than two years since the start of the COVID-19 pandemic; however, the U.S. supply chain continues to struggle to meet demand. Recently, supply chain woes have especially impacted families with infants due to the baby formula shortage caused, in part, by bacterial contamination in Abbott Nutrition’s factory in Michigan. Abbott accounts for 40% of the market share for baby formula and the resulting plant closure has decimated the supply of baby formula. Supply chain shortages continue to be an issue in every industry from car manufacturing to food production. Not only is there a shortage of raw materials, but labor shortages have become a mounting problem. Shortages in truck drivers and warehouse workers are greatly impacting the manufacture and delivery of raw materials and finished goods.

On top of all this, geopolitical issues are straining global financial markets as the desire for socioeconomic justice persists. The Russian invasion of Ukraine has caused the U.S. and several other countries to place economic sanctions on Russia. The U.S. has focused its efforts on sanctioning Russian banks, bans on Russian oil and travel, and asset confiscations for Russian oligarchs, among other things. The European Union (EU) has responded similarly to the U.S. and is now proposing a complete ban on Russian oil which would likely put further pressure on global oil and gas prices. The EU, particularly manufacturing powerhouse Germany, is highly dependent on Russian natural gas and oil.  Looming geopolitical pressures between China and Taiwan have also sparked more volatility in financial markets as President Biden said on May 23rd that the U.S. would defend Taiwan if China invaded. An invasion of Taiwan could bring about enormous economic disruption between the U.S. and China, causing more supply chain and inflation problems as China is the United States’ largest trading partner.

Bear Market Territory

The recent stock market drop from nose-bleed valuations was incited by unabated inflation and the Fed’s untimely interest rate hikes to “rail in” its excessively accommodative monetary policy. The Fed is playing catchup after continuously assuring markets that inflation was transitory. Unfortunately, markets have suffered from this adjustment, and bear market worries have ensued. Technically, a bear market occurs when an index or individual stock takes a roller coaster-like plunge of 20% or more from a recent high. The S&P 500 has been hovering near bear market territory as it is down -17.8% year-to-date. The Nasdaq is already in bear market territory down -28.0% year-to-date.  The Dow Jones Industrial index has experienced a tamer ride, down -12.1% year-to-date. These metrics have investors on this monetary policy-induced joy ride wondering if they need to be concerned with a longer-term bear market and a potential recession or worse. Experts at Moody’s analytics and the Wall Street Journal say that the chance of a recession is around 30% and will increase if inflation is not subdued.

Seasoned investors know that bear markets are inevitable, and they don’t last forever. See Figure 2. The most recent bear market in the S&P 500 was prompted by the COVID-19 pandemic and economic fallout from government-mandated lockdowns which caused the index value to fall -34%. However, this steep drop was followed one month later by an epic ascension. See Figure 3. Other recent bear markets such as those associated with the Global Financial Crisis and the Tech Bubble burst lasted 17 and 31 months, respectively, before climbing back into a bull market. While this graph might shake younger, trade-oriented investors, seasoned investors understand that this is another cycle that the market must take.

Figure 2: Historical Bear Market Cycles

Figure 3: Historical Bear Market Events

Market Performance of Non-stock Market Investments

Although the broad stock market has been descending since January, other sectors have experienced positive returns. For example, the energy sector has been profiting from the runup in overall energy prices and Bloomberg reports the sector is up 1.9% this year. This is the second-best sector performance behind consumer discretionary spending which is up 3.0%. Not only is traditional energy investing trending right now but more investors, particularly, ESG (Environmental Social and Governance) investors are allocating more capital into the alternative energy space. Rising oil prices have both investors and consumers realizing the United States needs to evaluate its dependence on fossil fuels and how the transition to renewable energy sources could be managed more smoothly and strategically.

Another industry experiencing favorable returns year-to-date is the agricultural industry. The COVID-19 pandemic and rising inflation only highlighted the importance of a stable, secure food supply and that regardless of what is happening in the global economy, people still need to eat. Farmland, which historically has a positive relationship with inflation, has experienced strong returns throughout 2021 and 2022. Farmland values have soared 20-30% this year alone with the largest gains seen in the Corn Belt of the Midwest. Strong commodity prices are bolstering returns as corn, soybean, and wheat prices have been surging due to the geopolitical uncertainty in Russia and Ukraine, both large producers of bulk agricultural commodities. While the U.S. growing season is just getting started, strong grain prices are making for favorable market dynamics and improved farm profitability.

Riding the Volatility Spins

The volatility in the stock market may have some investors worried about their portfolio security.  If market history has taught us anything, it’s those long-term investors that get in and stay in that realize the best investment performance.  Trying to time the market’s natural gyrations is generally a fool’s errand.  Staying the course with a sensible asset allocation and enjoying the ride has proven itself time and time again.

The S&P 500 has a 20-year total return of 9.5% and as investors allocate more to stocks and less to bonds, their return potential rises. See Figure 4. Allocating more to stocks also historically means more volatility.  Figure 4 also shows that the longer the investment horizon, the lower the overall risk. Investing just 1 year in any asset can give any investor significant exposure to risk but as their investment horizon lengthens, they can smooth out much of that volatility associated with shorter time horizons. If we compare the recent year-to-date graphs of market indices (Figure 1) with the long-term performance of each of these indices we see that while there are periodic dips, in the long run, the market proceeds on a steady upward trend. This comparison leads to the conclusion that the best thing to remedy volatility, is time. The same goes for riding a rollercoaster. While on the rollercoaster, you may be tempted to want to stop the ride on that nauseating barrel roll. But if you roll with the changes and ride it out to the end, you may realize the thrill and enjoyment and find yourself back on the ride again.

Figure 4. Historical Returns Through Time

Re-Evaluating the Role of Gold in Investment Portfolios

2022 has proven to be a particularly interesting and bumpy ride for investors as we travel the economic path toward the end of our rainbows and the achievement of our long-term savings and investment goals. Recent monetary policy and global events have investors reconsidering what role gold plays in a modern investment portfolio. Diversification into inflation hedging assets, such as gold, will be a key consideration for investment portfolios to manage the inflation bumps and monetary policy U-turns. In many respects, the market has indicated early in 2022 that what may be the key to surviving this rocky economic road is by looking ahead to what’s at the mythical end of the rainbow: a pot of gold. 

Gold Rush

What do today’s investors and gold prospectors from the 1800s have in common? They are both rushing to get their hands on gold. Inflation woes and market uncertainty have rightfully sent the gold market into a frenzy as investors seek its real asset protection. As of April 25th, gold’s value is up around 10% from the previous year and is up 22.8% since right before the pandemic began in March 2020. While it has given up some gains in recent weeks, it still has strong year-to-date returns. Frankly, gold has been a sparkling investment since 1999 when its price averaged around $252.50 per ounce. Today, gold is trading at closer to $1,900 per ounce, creating a strong upward trend over the last 23 years. Gold reached an all-time high on March 9th when the price of the “barbarous relic” topped out at $2,053.60. Volatility still plagues the real asset but for gold investors who have buried American Eagle coins, gold bars, or equivalents in their safety deposit boxes or investment portfolios, the reward has paid off.

Speculators have questioned whether this gold rush will continue throughout 2022. To be certain, gold prices will be very dependent on what happens with inflation, interest rates, and the Russian/Ukrainian conflict.  The barbarous relic’s bullish trends are currently projected to continue throughout 2022 but even the most optimistic investors will continue to keep an eye on its volatility because as we have experienced “All that glitters is not gold.” – William Shakespeare.

Gold Performance During Economic Crisis & Inflationary Pressure

Real assets such as gold or real estate like farmland have often been favored during times of economic crisis and global uncertainty since fiat money printing becomes global governments’ default solution. Investors flocked to real assets during The Great Inflation of the 1970s when unemployment levels were high, and the economy was turbulent. We saw similar circumstances during the 2008 Global Financial Crisis. Initially, gold also faced considerable volatility in 2008 as investors sought liquidity across all investment holdings.  After the initial shock of the financial crisis, people bought gold when they sensed that the money printing had started in earnest. Growth slowed down in 2012 as the Federal Reserve lowered interest rates and a weaker dollar resulted. The figure below shows the annual price movements of gold during this time period.

Source: U.S. Bureau of Labor Statistics

              The most recent notoriety surrounding gold has understandably been driven by its relationship with inflation. Recently inflationary numbers accelerated with CPI growing more than 8% year over year and the narrative has flipped from “transitory inflation” to “secular inflation” and there is a growing concern for stagflation (slow economic growth with high inflation). The Federal Reserve has reversed course and dropped its inane “transitory” policies and is aggressively raising interest rates to temper demand and combat rising prices. However, with supply chains still recovering from the COVID-19 pandemic, the Russian/Ukraine conflict has thrown another wrench into global economic gears as the market for commodities, such as oil, gas, and grains grows more fractured.

What does all of this have to do with Gold? Well, this considerable market uncertainty has investors accumulating real assets and gold because of its historical positive correlation. In the past, as inflation levels have risen so has the price of gold. We discussed this dynamic in more detail in our February insight. Gold’s positive correlation with inflation has continued to hold in 2022 with gold prices peaking just as investors are seeking protection from high inflation.  The following table shows the correlations of various asset classes, including gold, to Consumer Price Index (CPI).

Historical Correlations of Financial Assets with Inflation (1970-2020)

Source: Data supplied by the TIAA Center for Farmland Research

Gold’s Performance in an Investment Portfolio

Gold can play a valuable role in an investment portfolio not only for its inflation hedging capabilities but also for its historical negative correlation with bonds and equities given its safe-haven attributes in times of war and geopolitical turmoil. Some investors argue that gold is unattractive within an investment portfolio because of its volatility and inability to produce an income stream. However, asset allocators and investors might be rethinking portfolio construction as recessionary fears persist and U.S. stock indices continue their volatile fall. The S&P500 is down –11.25% year to date with the NASDAQ and Dow Jones also posting similar losses for the period of -18.05% and -6.14%, respectively. In contrast, gold is up close to 4% year to date and investors are aggressively rethinking their portfolio diversification strategies.

Source: Q1 Market Commentary

              There are a variety of alternatives for investors to gain exposure to the gold market.  The most obvious is buying gold coins or bullion directly and storing them in a secure vault at a financial institution. Buying gold directly is unlikely to be the best option for many investors due to the high frictional cost of storage and security for the physical asset. Another option would be to invest in the supply chain for gold such as gold miners. Barrick Gold Corporation (GOLD) is the largest gold company in the world. The Toronto-based company mines, processes, and has reserves across five continents. Its stock price is up 7% year over year.  A more diversified gold mining play is the VanEck Gold Miners ETF up 20% year over year.  For investors seeking less direct gold exposure but still scouting for inflation protection, Horizon Kinetics Inflation Beneficiaries ETF (INFL), offers broad diversification benefits. We wrote about INFL in February when it was added to the Servant Financial portfolio. It currently has $896 million in assets under management with holdings in gold and other mining companies, energy and food infrastructure, and transportation: all sectors that have experienced some of the most positive price movements in the underlying commodities or products and services.

Traditional investment theory cites the most prevalent portfolio benchmark is a 60/40 split in an

investment portfolio with 60% equities or stocks and 40% fixed income instruments or bonds. Under this portfolio model, investors would be down -5.6% quarter to date as both U.S. stocks and bonds were hammered by rising inflation. The performance of the traditional 60/40 portfolio compares unfavorably with Servant Financials’ sample moderate risk client. The Servant model portfolio also holds a diversified mix of global equities and bonds but also includes a healthy allocation to precious metals. This inflation-protected model portfolio was down only -0.57% quarter to date. See the accompanying asset allocation chart.

Within this Servant model portfolio, INFL had total returns of 8.8% for the first quarter of 2022, Berkshire Hathaway Class B shares (+17.6%), Farmland Partners Inc shares (+14.6%), and various precious metal investments (GDX +19.0%, Sprott Gold & Silver Trust +8.9% and iShares Silver ETF +7.2%) accounted for the bulk of the favorable performance variance to the traditional 60/40 benchmark.

We will continue to monitor the performance of gold and other inflation hedges and adjust asset allocation as we chart the optimal path to the achievement of your long-term savings and investment goals. If you would like to discuss your financial situation and how to secure that pot of gold at the end of your investment rainbow, please contact us at john@servantfinancial.com.

white-arrow