Email us at info@servantfinancial.com to talk to a financial advisor today!

Email us at info@servantfinancial.com

Fed Sends Mixed Messages

On September 18th, the Federal Reserve cut interest rates by 50 basis points, marking the beginning of a new rate-cutting cycle. Historically, such a large initial rate cut has typically been reserved for times of economic crisis. Updated economic projections provided by the Fed, referred to as the “dot plots”, indicate that the Fed now anticipates a higher ending 2024 unemployment rate (4.4% vs. 4.1%), higher GDP growth (2.0% vs. 1.4%), lower inflation as measured by the Personal Consumption Expenditure (PCE) index (2.3% vs. 2.4%), and a reduced 2024 year-end Federal Funds rate (4.4% vs. 4.6%) compared to its December 2023 forecasts. These updated forecasts hardly suggest any economic downturn or crisis is around the corner. Both the bond market and the Fed expect an additional 50 basis points in cuts by year-end, implying a 25 basis-point reduction at each of the two remaining Federal Open Market Committee (FOMC) meetings this year.

The Fed’s 50 basis-point cut lacks clear justification based on currently available economic data. Core and headline inflation continue to exceed the Fed’s 2% target, and base effects and housing dynamics suggest that core inflation could remain sticky. Further, on September 26th, the U.S. Bureau of Economic Analysis reported that U.S. GDP grew at an annual rate of 3.0% for the second quarter of 2024. This final 2Q24 GDP figure was revised upward from the initial estimates and reflects healthy economic growth, driven by strong consumer spending, an upturn in private inventory investment, and business investments. Additionally, financial conditions are at their lowest since May 2022, and jobless claims continue to fall. Initial jobless claims in the U.S. fell to 218,000 for the week ended September 21, lower than analyst estimates of 223,000 to 225,000. The latest jobless claims represent a four-month low, indicating a stronger labor market than some analysts and perhaps the Fed anticipated. In addition, the latest Bank of America Fund Manager Survey shows that over 50% of respondents do not foresee a U.S. recession within the next 18 months, i.e.. the consensus expectation remains for a soft landing.

The Fed’s decision to cut interest rates by 50 basis points last week has sent mixed messages to the markets.  The ensemble of market reactions suggests the Fed has ignited risk-on behavior.:

  1. Stock Market: Initially, there was a muted or even negative reaction in the stock market. This might seem counterintuitive because rate cuts are typically viewed as positive for stocks due to lower borrowing costs which can stimulate growth. However, the immediate dip could be attributed to investor concerns that the larger-than-expected cut might indicate the Fed’s worries about underlying economic weaknesses, particularly concerning the labor market. However, following the initial confusion, there has been a meaningfully positive reaction with stocks rallying sharply as market consensus moves toward the assessment that the Fed does not have any inside information on data portending broad economic weakness.
  2. Bond Market: The bond market showed a significant and immediate reaction with the 10-year Treasury yield spiking to 3.78% on September 26th from 3.64% the day before the Fed’s rate cut. The bond market seems to be repricing for higher expected inflation and/or stronger economic growth in the longer term post the Fed’s cut.
  3. Gold: Gold spiked to an all-time high on September 26th by topping $2,700 per ounce for the first time in history. This signals both the possibility of a Fed dovish policy mistake and safe haven buying in response to the escalation of the wars in Ukraine and the Middle East.
  4. Bitcoin: Likewise, bitcoin, or digital gold, has popped above $65,000 and is up almost 4% on the 26th.  For market technicians, the $65,000 price per bitcoin represents a key technical level with many analysts suggesting that a breakthrough of this level may signal the beginning of another epic run. Today’s price appreciation may signal the start of a run to Bitcoin’s all-time high, previously set in November 2021 at approximately $69,000.  Pop zing!
  5. Energy Markets:
    1. Oil: Oil prices have shown limited volatility as of late. Brent crude has been range-bound around $75 per barrel. There’s some underlying sentiment of a bear market in oil, with some hopes pinned on-demand increases or external stimuli like actions from China to boost prices.  Escalation of the Middle East war between Israel and Iran’s Hezbollah proxy in Lebanon could drive increased risk premiums into oil prices.
    2. Natural Gas: Natural gas experienced a significant jump, with futures up over 8% recently, possibly due to the aforementioned geopolitical tensions in the Middle East or expectations of increased demand from electricity producers looking for energy resources to satisfy the growing demand for Artificial Intelligence computing capacity.
    3. Uranium: Uranium has seen quite dramatic swings in prices in 2024.  The spot price of uranium has decreased by (11.6%) since the beginning of 2024, reaching around $80 per pound as of late September, after hitting a 16-year high earlier in the year due to increased demand and tight supply.   Despite this year-to-date decrease, uranium has been the best-performing energy commodity year-over-year, despite its decline from a peak of $106 in February 2024.  The supply-demand imbalances in uranium are long-term in nature as it takes around a decade to bring new supply online.  As we’ve outlined previously, there is strong interest in uranium due to its role in nuclear power production, especially with global pushes towards decarbonization and the “greening” of nuclear energy. Uranium prices and Sprott Uranium Miners ETF (URNM) have been raging as of late. URNM is up about 13% since the last FOMC meeting.

X Grok AI rendering of Three Mile Island nuclear plant


Last week, BlackRock, Global Infrastructure Partners, Microsoft, and MGX announced an AI partnership that could invest up to $100 billion in U.S. energy infrastructure and data centers. Additionally, Constellation Energy signed its largest-ever power purchase agreement with Microsoft, adding 835 megawatts of carbon-free, nuclear energy to the grid. Microsoft’s long-term offtake commitment catalyzed the restart of the decommissioned Three Mile Island nuclear plant in Pennsylvania, with key permits still required.  The deal is projected to contribute $16 billion to Pennsylvania’s GDP and generate over $3 billion in taxes.

Prince fans will remember an analogous Fed policy instance that occurred in 1999.  At the December 21, 1999, FOMC meeting, the Fed kept interest rates unchanged, citing uncertainties around the century date change across the nation’s information processing systems. Nearly a year later, in January 2001, the Fed began cutting rates, starting with a 50 basis-point reduction due to weakening production, declining consumer confidence, tightening financial conditions, and high energy prices.   At that time, jobless claims and headline inflation were higher than today.  Core inflation and manufacturing activity were lower. The price-to-earnings (P/E) ratio of the S&P 500 was 30.1x, compared to 27.5x today. However, the technology sector’s price-to-sales ratio is currently over 30% higher than it was during the peak of the 2000 Tech Bubble.  The top 10 companies in the S&P 500 now make up 34% of this large-cap index, compared to 25% at the height of the Tech Bubble.

Servant Financial’s market commentary and portfolio recommendations for this 1999-like party atmosphere are as follows.  S&P 500 valuations appear rich using metrics like the Shiller P/E ratio.  Further, yield-to-earnings comparison (the inverse of the P/E ratio versus bond yields) suggests U.S. stocks are less attractively priced relative to bonds than at any time since the 1990s and are reminiscent of conditions before the dot-com bubble. For now, looser financial conditions introduced by the Fed (characterized by lower interest rates, higher liquidity, and easier credit) may end up keeping the ‘party’ going for some time, but no one knows for sure. We will continue to keep a watchful eye on the adults (10-year Treasury yield and gold) and the underage, yet savvy teenager (bitcoin) for messages and clues that things are getting out of hand and it’s time to leave the party. We’ll also keep an eye on inflation rates, shifts in Fed policy guidance, or significant geopolitical events that could also serve as catalysts for a change in market dynamics.

In light of these economic uncertainties, we believe it’s prudent for investors to continue to maintain globally diversified portfolios. Globally diversified portfolios are comprised of traditional investments in stocks and bonds but importantly also include diversifying assets like gold, silver, shares in gold miners, bitcoin, and real assets such as uranium and farmland. These assets offer a hedge against inflation, and currency fluctuations, and provide portfolio stability during periods of market volatility.


Little Ditty About Gold

In the investment world, it is often said, “It is better to fail conventionally than to succeed unconventionally.” Investors’ attitudes have been shaped over the last four decades to believe that the best portfolio strategy is to simply invest in a traditional benchmark 60/40 stock-bond portfolio.  The Wall Street mantra to buy “stocks for the long run,” balanced with an allocation to government and corporate bonds for their stability and safety of income reigns in investment advisory circles.  As we noted in last October’s “Got Gold?”, modern investment portfolios have generally been constructed with gold absent from the asset allocation, despite gold’s long history of portfolio diversification benefits and as a hedge against inflation and geopolitical risks. For example, around 71% of U.S. advisors have less than 1% exposure to gold.  And only 2% of U.S. advisors had between 5% and 10% of gold exposure in portfolios, with none having an exposure exceeding 10%, according to Bank of America Global Research.

Luminary investor Peter Lynch, portfolio manager of the highly successful Fidelity Magellan Fund and writer of “One Up On Wall Street: How To Use What You Already Know To Make Money In The Market” takes a decidedly balanced approach to investing.  He often condensed his commonsense approach to “Never invest in anything you can’t illustrate with a crayon.”  He further advised that if you cannot summarize your investment thesis in a concise two-minute elevator speech (or convey your thesis through a short song or ditty), then you should simply move on.

Crayon Illustration

Our fanciful, fictional “crayon illustration” this month begins by time traveling back to the 1980s to a tune about “Two American kids growin’ up in the heartland.”  A rural upbringing with its Tastee-Freez pop culture instilled in our young lovers a great appreciation for scarce assets like gold, farmland, and true love.  In fact, the singer-songwriter in our tale was a co-founder of the Farm Aid concert fundraiser in Champaign, Illinois in 1985 along with Willie Nelson.  Of course, we’re talking about John Cougar Mellencamp and his little ditty about Jack and Diane.  Let’s imagine that our young Jack and Diane developed an unconventional investment plan back in 1982 after their “little ditty” got some AM/FM radio airtime.

These “two American kids growing up the heartland” just “doin’ the best they can” did some napkin illustrations while eating their $1.50 chili dogs.  Today, a gourmet chili dog costs $5.19 at Portillo’s, or 3.5 times the price of a chili dog in 1982.  Jack and Diane took a portion of the royalties from their certified gold single (1 million in unit sales) and decided to invest it in a scarce asset with stable, enduring value across time and cultures.

“Jackie sits back, collects his thoughts for the moment.  Scratches his head and does his best {Peter Lynch}.    “Well then, there Diane, we oughta {just buy some gold.} “Diane says, Baby, you ain’t missin’ a thing.”

Jack has been thinking about his awesome good fortune of a number one single and so they buy a single gold bar at the average price of gold in 1982 of $447 an ounce for a total investment of $179,000.  Our hopelessly romantic young lovers bury that gold bar behind their favorite “shady tree” on the generational family farm for safekeeping.

Today, that gold bar birthed from true love and a solid gold single about rural life in America is now worth a cool One Million Dollars! Gold’s spot price just surpassed $2,500 per troy ounce on August 16th, an all-time high. With gold bars typically weighing in at about 400 ounces, that makes Jack and Diane’s gold bar worth around $1 million, or 5.6 times its cost.

Source: Trading Economics

Got Gold Reflections

In our October 2023 gold report, we cited commentary from former Credit Suisse economist Zoltan Pozsar that appears to be quite prescient with the benefit of 10 months of hindsight:

Commenting further on the commodities allocation Pozsar echoed the words of Ray Dalio on “gold, inflation and growth”:

“Within that commodities basket, I think gold is going to have a very special meaning, simply because gold is coming back on the margin as a reserve asset and as a settlement medium for interstate capital flows. I think cash and commodities is a very good mix. I think you can also put, very prominently, some commodity-based equities into that portfolio and also some defensive stocks. Both of these will be value stocks, which are going to benefit from this environment. This is because growth stocks have owned the last decade and value stocks are going to own this decade. I think that’s a pretty healthy mix, but I would be very careful about broad equity exposure, and I would be very careful of growth stocks.”

Year-to-date through the week ended August 16th, gold has indeed been shining with total returns of 19.4%, leading all major asset classes except Bitcoin. It’s been a safe haven’s dream, outperforming many traditional stock indices.  VanEck Gold Miners ETF (GDX) and iShares Silver Trust (SLV) have also been showing some luster while playing some catch-up to gold over recent years with total returns of 27.7% and 23.8%, respectively, over the same period.

Bitcoin (digital gold) continues to be this decade’s top hit with total returns of 40.7% year-to-date. If gold is the old reliable of the 1980s, Bitcoin’s been the wild, unpredictable teenager of this era.

The midstream energy asset class nosed out U.S. large caps (S&P 500) with a total return of 17.6% compared to 17.5% for the S&P 500 over this period.  The Magnificent Seven technology stocks, particularly Nvidia, have been responsible for a substantial majority of the S&P 500 year-to-date gains, with Nvidia alone skyrocketing by 162.2%.

With the Federal Reserve expected to embark on a rate-cutting cycle at its next meeting in September, ongoing wars in Ukraine and the Middle East, and Presidential candidates floating inflationary policy trial balloons like price controls (“inflation’s absolute best friend for life”), hiking and lowering of corporate income tax rates, tariffs on imports, taxing of unrealized capital gains, forgiveness of student loan debt, and free healthcare for all, Pozsar’s statement on inflation from that Got Gold? The article is also looking like a 24-karat prediction:

“Two percent inflation and going back to the old world, I don’t think it stands a snowball’s chance in hell. Low inflation is over and we’re not going back.”

Forward Positioning

With continued U.S. dollar purchasing power erosion due to inflation, gold continues to serve as a store of value, outperforming bonds over the past five decades as illustrated by our protagonists Jack and Diane. Gold has returned 7.9% annualized over the past 50 years, outperforming U.S. intermediate-term bond returns of 7.0%.  Gold has also been one of the top-performing assets since the peak of the Tech Bubble in March 2000 with an annualized return of 9.2%, outperforming U.S. large-cap stocks’ total return of 7.8%.

Exhibiting low correlations with major asset classes and a positive correlation with inflation, gold can serve as a strategic portfolio diversifier. Demand from U.S. investors is starting to increase, while strong demand from central banks and geopolitical and financial risks have helped drive gold to all-time highs in 2024. While there are risks, current fiscal policies, geopolitical tensions, central bank dynamics, and expected easing in monetary policy could bode well for gold returns in the coming years.

Potential risks to gold include higher real interest rates and the emergence of Bitcoin as a potential mainstream alternative. Since 2016, Bitcoin has outperformed gold, although gold has outperformed very recently.  The growing interest in Bitcoin among investors, particularly younger generations, may be cannibalizing gold demand. Servant Financial advocates a blended approach that includes physical gold, Bitcoin/digital assets, and gold miners as we seek to hedge portfolios for the inevitable erosion of purchasing power resulting from inflationary monetary policy.

Record gold prices and signs of cost stabilization have led to notable margin improvements for gold miners. Gold miner production has reaccelerated, with large miners seeing improvements in cash flow as capex has leveled out since the start of the year. Stock performance of the miners has also been improving, with gold stocks outperforming U.S. large-cap stocks in 2024. Given record gold prices, we see the potential for further production improvements at attractive margins. Servant Financial plans to maintain existing client portfolio exposures to gold miners but intends to trim positions if the current balanced sentiment on gold miners moves toward excessive bullishness.

Let’s close this golden ditty about Jack and Diane with a karaoke sing-along, “Oh, let it rock, let it roll.  Hold some gold to save your souls. Holding on to sixteen as long as you can. Changes come around real soon, make us women and men.”

Got Gold?

Hedge fund investor and billionaire Ray Dalio of Bridgewater Associates once retorted “If you don’t own gold, you know neither history nor economics.” Gold interest began spiking again during the COVID-19 pandemic as investors flocked to real assets to hold their money in while equities were flopping. As the S&P 500, NASDAQ, and Dow Jones have started on a downward trend once again, gold has again been experiencing gains in value. Hopefully, most readers can answer yes when asked “Got Gold?”  Servant Financial clients can assuredly answer affirmatively as outlined at the close of this article.

Despite Dalio’s admonition, gold holders, or gold bugs as they are affectionally called, are in the minority of U.S. investors. The Gold IRA Guide conducted a survey in 2020 to reveal the opinions of Americans surrounding gold and silver ownership. 1,500 Americans were surveyed between the ages of 18 and 65+. The survey revealed that 89% answered “no” when asked “Got Gold?”  Only 10.8% of respondents owned either just gold (4.3%) or both gold and silver (6.5%). Some respondents just owned silver (5.1%), suggesting a combined 84% of Americans owned neither gold nor silver at that time.

An updated survey by Gold IRA Guide in May 2022 of 2,500 American households found that almost 4 out of 5 reported having done nothing with their investment portfolio or retirement accounts to hedge against generationally high inflation.  Consumer Price Inflation (CPI) was reported above 8% for all items in both March and April of 2022.  Frankly, I think this is a sad commentary on institutional money management because it is very likely that many of these survey respondents were working with trusted investment advisors.  Unfortunately, a large majority of money management firms have apparently not “studied history or economics.”  Lemming-like, many institutional money managers are beholden to the traditional 60/40 stock and bond regime that has worked so well for the last 3 decades since the start of the 1990s.

Ray Dalio has also stated that “There are two main drivers of asset class returns – inflation and growth.”  We know from history that growth has been the dominant driver since the 1990s aided by a secular decline in inflation and interest rates.  Unfortunately, over the next 30-plus years, our elected geniuses in Washington and their co-conspirators at the Federal Reserve mistook that secular trend for permanence and repeatedly doubled down on the mantra “deficits don’t matter.” While most American households cannot feasibly operate under a budget deficit, the U.S. government seems to think they can. Washington elites ignored “history and economics” by spending and printing without limitation.  It’s as if they were seeing the world through Morgan Wallen Whiskey Glasses:

Line ’em up, line ’em up, line ’em up, line ’em up

Knock ’em back, knock ’em back, knock ’em back, knock ’em back

Fill ’em up, fill ’em up, fill ’em up, fill ’em up

‘Cause (INFLATION) ain’t ever coming back.

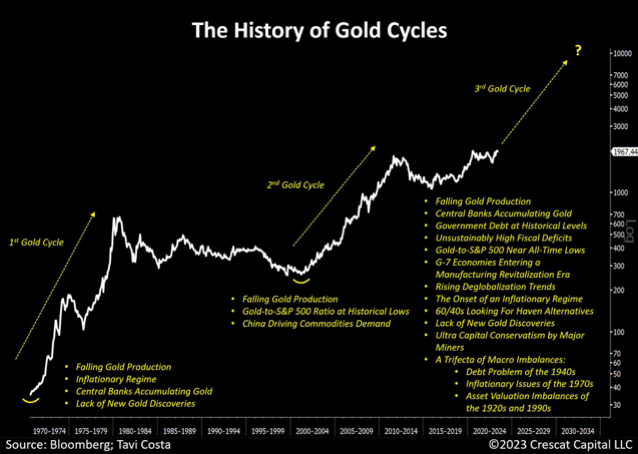
However, it is now increasingly apparent that we are entering a secular period in history where inflation trumps growth as the primary driver of asset class returns.  Safe passage through this new secular inflationary period requires polishing up on the history of gold cycles.  The chart below from Octavio Costa at Crescat Capital provides a nice overview of gold’s price history since the 1970s.  It’s important to note on this timeline that in August 1971 President Nixon closed the “gold window” which prevented foreign governments from redeeming their dollars for gold.  Up until this point, gold had served as an important governor on U.S. spending and printing.

History shows that when gold was the primary monetary unit before the adoption of gold-backed fiat currencies, gold also served as a governor of war.  Would-be aggressors were limited in financing war against their neighbors by the amount of gold stored in their treasuries and the amount of gold booty or other resources they could recover from their conquests. The same goes for pirates and naval conquests.

For those readers interested in digging a little deeper into gold, we’ve found that the most comprehensive analysis of gold markets available is entitled “In Gold We Trust”, prepared annually by Incrementum.  Incrementum published their 417-page, 17th edition earlier in 2023 entitled Showdown | In Gold We Trust report 2023 (hyperlinked to YouTube summary presentation of the report).

Incrementum presciently entitled their May 2023 edition “Showdown.”  The report summarizes the four important Showdowns that they expected to play out over the next year or more:

  1. West Versus East Geopolitics
  2. Competing Currencies (BRIC+ Currency Bloc)
  3. Failing Monetary Policies
  4. Price of Gold (gold price advances have been tame relative to Incrementum’s cycle view)

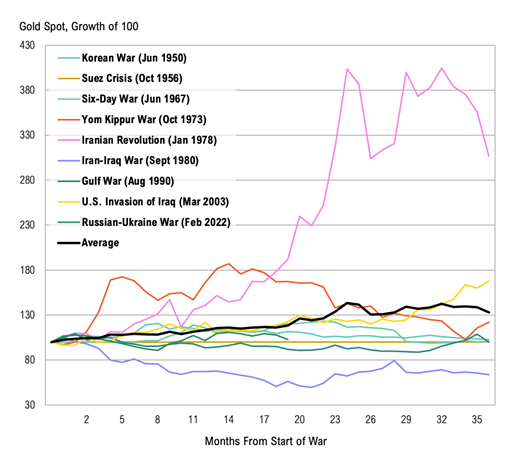
Obviously, Incrementum was aware of the Russia-Ukraine “showdown” at the time of publication but likely could not have anticipated another violent “showdown” in the Middle East.  Sadly, the inhumanity of humanity intervened again in recorded history with another Middle Eastern war on the 50th anniversary of the Yom Kippur War of 1973 (also known as the Fourth Arab–Israeli War).  That war began on 6 October 1973, when an Arab coalition led by Egypt and Syria jointly launched a surprise attack against Israel on the Jewish holy day of Yom Kippur. Following the outbreak of hostilities, both the United States and the Soviet Union initiated massive resupply efforts for their allies (Israel and the Arab states respectively) during the war which led to a confrontation between the two nuclear-armed superpowers.

Source: Bloomberg, SpringTide

Incrementum included a thoughtful, far-reaching interview with former Credit Suisse economist Zoltan Pozsar.  Pozsar is a Hungarian-American economist known for his analysis of the global shadow banking system.  He published a widely read December 2022 analysis while at Credit Suisse entitled “War and Commodity Encumbrance”.

Pozsar has since started his own macroeconomic advisory firm specializing in funding and interest rate markets called Ex Uno Plures.  The firm’s name (“out of one, many” in Latin) is the antonym of E Pluribus Unum (“out of many, one”), the motto on the Great Seal of the United States and dollar bill.  The firm’s raison d’être and the main thesis of the War and Commodity Encumbrance whitepaper is that “for generations, investors have been operating in a unipolar macroeconomic environment, where the U.S. dollar reigned supreme globally and where E Pluribus Unum was the perfect motto to describe what became known as the global dollar cycle. However, the conflict between the U.S. and China is set to reshape the global monetary order centered around the U.S. dollar. De-dollarization, the re-monetization of gold, the invoicing of a growing number of commodities and goods in renminbi, and the proliferation of CBDCs (Central Bank Digital Currencies) will challenge the US dollar’s hegemony (“out of one, many”).”

Incrementum’s headline quote from the Pozsar interview reads, “Two percent inflation and going back to the old world, I don’t think it stands a snowball’s chance in hell. Low inflation is over and we’re not going back.”

Here are some of Pozsar’s specific recommendations from the interview for adapting to the New World Order as he sees it (emphasis added):

  • We are moving into a multipolar reserve-currency world where the dollar will be challenged by the renminbi and the euro for reserve currency status.
  • These currencies, especially the renminbi, would not necessarily be used as a reserve currency, but rather to settle trade. Gold could play an increased role here. (Pozsar notes that since 2016-17, the renminbi has been convertible to gold on the Shanghai and Hong Kong Gold Exchanges.)
  • The Chinese are using swap lines to settle international trade accounts. This is a fundamentally different approach from the dollar reserve framework and would mean that trade can occur in renminbi without nations needing to hold vast reserves of the currency.
  • The various crises that today’s financial market participants have witnessed were solved by throwing money at whatever problem arose. The current inflation problem is different.
  • This situation is also vastly different from the late 1970s when Paul Volcker curbed inflation by prolonged high-interest rates. Chronic underinvestment in the resource sector and labor issues will cause inflation to remain sticky.
  • The traditional 60/40 portfolio allocation will struggle in this environment. Pozsar recommends a 20/40/20/20 (cash, stocks, bonds, and commodities) allocation.

Commenting further on the commodities allocation Pozsar echoed the words of Dalio on “gold, inflation and growth”:

“Within that commodities basket, I think gold is going to have a very special meaning, simply because gold is coming back on the margin as a reserve asset and as a settlement medium for interstate capital flows. I think cash and commodities is a very good mix. I think you can also put, very prominently, some commodity-based equities into that portfolio and also some defensive stocks. Both of these will be value stocks, which are going to benefit from this environment. This is because growth stocks have owned the last decade and value stocks are going to own this decade. I think that’s a pretty healthy mix, but I would be very careful about broad equity exposure, and I would be very careful of growth stocks.”

Servant Financial client portfolios have long held, meaningful allocations to gold.  Below is a summary of gold allocations by client portfolio risk profile:

The chart below provides the performance of a Moderate Risk client portfolio after management fees against a traditional 60/40 global composite portfolio (without management fees) over the past twelve months ended October 20, 2023, and highlights the benefit of holding traditional gold and precious metals and digital gold over this time. (Past performance is not indicative of future performance.)

Moreover, bitcoin broke emphatically through the $34K level on October 24, 2023, and is up some $8,400, or 32%, in the past 30 days after the United States Court of Appeal issued a court mandate this week requiring Grayscale Investment’s application for a spot Bitcoin exchange-traded fund (ETF) to be reviewed by the Securities and Exchange Commission (SEC).  The mandated SEC review could potentially pave the way for the conversion of the Greyscale Bitcoin Trust (BTC) from a trust (trading a week ago at a 12% discount to the net asset value (NAV) of underlying bitcoin held) to a spot ETF trading much closer to NAV. Servant predicted this “Bitcoinalization” as we coined it back in July of this year.

The title of this month’s newsletter is a hat-tip to the highly successful “Got Milk?” ad campaign of the 1990s and early 2000s.  Trends in consumption and investment evolve, affected by the cyclical and episodic nature of humanity and a myriad of factors from health and ethical concerns to technological innovations and geopolitical events. Just as the dairy industry has faced challenges and adapted, the gold investment landscape is also undergoing a transformation and monetary renaissance. The intrinsic value of milk as a household staple of a well-balanced diet is akin to the enduring value that gold brings to a well-diversified investment portfolio.  Just as there have been resurgences in milk consumption through innovation and adaptation, the allure of gold, gold miners, and other scarce stores of monetary value remains. A “Got Gold?” mindset offers investors a timeless refuge, especially in an era characterized by economic uncertainties, inflation, and geopolitical unrest.


Blessing for Peace

May those who make riches from violence and war,

Hear in their dreams the cries of the lost.

Excerpt from the poem by John O’Donohue


Commodities Refresh

Investors are shaking out the dustbin of their investment strategies to take a fresh look at commodities that haven’t seen a strong portfolio allocation since the 1970s/80s. With inflation rampant and the U.S. consumer price index hitting a 40-year high in September of 8.2% annual rate, it may be time to reconsider commodities as an investment option.  With this inflationary backdrop, it’s the first time in a generation that investors are losing sleep over inflation eating away at their purchasing power and devaluing their hard-earned life savings.

Conventional wisdom holds that commodity investments can provide beneficial portfolio diversification and hedging benefits against inflation. The commodity asset class is generally considered a tactical insurance policy rather than a strategic asset allocation.  The returns from commodities are more episodic driven primarily by inflationary surprises leading to commodities’ primary use as a tactical or trading instrument. Historically, commodities have not been a stable source of returns. On a forward-looking basis, investment firm Research Affiliates projects measly expected annual returns of 0.2% over the next ten years with an expected volatility of 15.5% for commodities (Asset Allocation Interactive research platform).  That said, commodities’ asymmetric return profile can provide valuable inflation protection similar to recoveries under an insurance policy from catastrophes.

Accordingly, we think of the commodity asset class as a tactical/trading tool to deploy before a wave of unexpected inflation or a long period of sustained inflation.   In hindsight, an opportune time to allocate to commodities was earlier in 2021 while the Federal Reserve’s mantra was “inflation is transitory” and well before the Fed’s December 15, 2021 inflation capitulation.  For instance, an allocation to the iShares S&P Goldman Sachs Commodity Index (GSCI) Commodity-Indexed Trust (GSG) returned 39.0% for calendar 2021 and has gained a further 26.0% through October 26, 2022.  Although we were appropriately concerned about inflation trends and adjusted Servant Financial client portfolios accordingly, we did not add any direct exposure to commodities to client portfolios. We opted instead to tilt model portfolios, subject to client risk tolerances, to real assets and inflation hedges with more stable risk-adjusted return profiles – gold/precious metals (CEF, GDX, SLV), bitcoin (GBTC, HUT), farmland (FPI), and Horizon Kinetics Inflation Beneficiaries ETF (INFL).

With spectacular commodity price responses to the unexpected spike in inflation now largely behind us, we are hard-pressed to add commodity exposure to client portfolios at this juncture unless we were highly confident that a long period of sustained inflation or what is called a Commodity Super Cycle (Super Cycle) has begun.  Super Cycles are extended periods of time of around a decade where commodities as a whole trade at prices that are greater than their long-term moving averages.  A Super Cycle will usually occur when there is a large industrial and commercial change in demand within a country or globally that requires more resources or supplies of commodities with large demand-supply imbalances.

There have been four super cycles over the last 120 years. The first started in late 1890 and was accelerated with widespread industrialization of the United States and industrial build-up associated with World War I. This cycle peaked in 1917. A new Super Cycle started in the late 1930s with the advent of World War II and peaked in 1951 after Europe and Asia’s heavy rebuilding from the war was complete.

The next Super Cycle started in the 1970s at the beginning of a long phase of global industrialization.  World economies industrialized and populations moved to urban centers, requiring more raw materials and energy to sustain this more intensive growth. The Vietnam War and Nixon’s closing of the gold window (halting foreign nations’ convertibility of U.S. dollars to gold and the dollar plunged by 1/3rd in the 1970s) were also significant factors in this cycle.

Note that the Vietnam War was one of the first Cold War-era proxy wars with eerily similar characteristics to the current Ukraine-Russian conflict. The Vietnam war took place in Vietnam, Laos, and Cambodia from November 1955 to the fall of Saigon in April 1975.  It was “officially” fought between North Vietnam and South Vietnam. However, North Vietnam was supported by the Soviet Union, China, and other communist allies.  While South Vietnam was supported by the United States and its democratic allies. Ominously, the Vietnam war lasted almost 20 years.  The 1970 Super Cycle came to an end as the Vietnam War ended and foreign investments fled as extractive industries became nationalized.

The most recent Super Cycle began in 2000 as China and its population of 1.3 billion, or 20% of the world’s population, joined the World Trade Organization.  With 1.3 billion Chinese jumping on the globalization and industrialization bandwagon, demand for energy and raw materials needed to build new megacities surged. The Great Recession hit in 2009 and ended this last Super Cycle.

The current spike in inflation and commodity prices could well mark the beginning of a fifth Super Cycle.  The Ukraine-Russia conflict, destruction and/or destabilization of global supply chains from the COVID-19 pandemic, breakdown in global trading partnerships, dangerously loose global central bank monetary policies, and a shortage of new investment in energy and raw materials exploration and development point to the makings of a fifth Super Cycle potentiality.

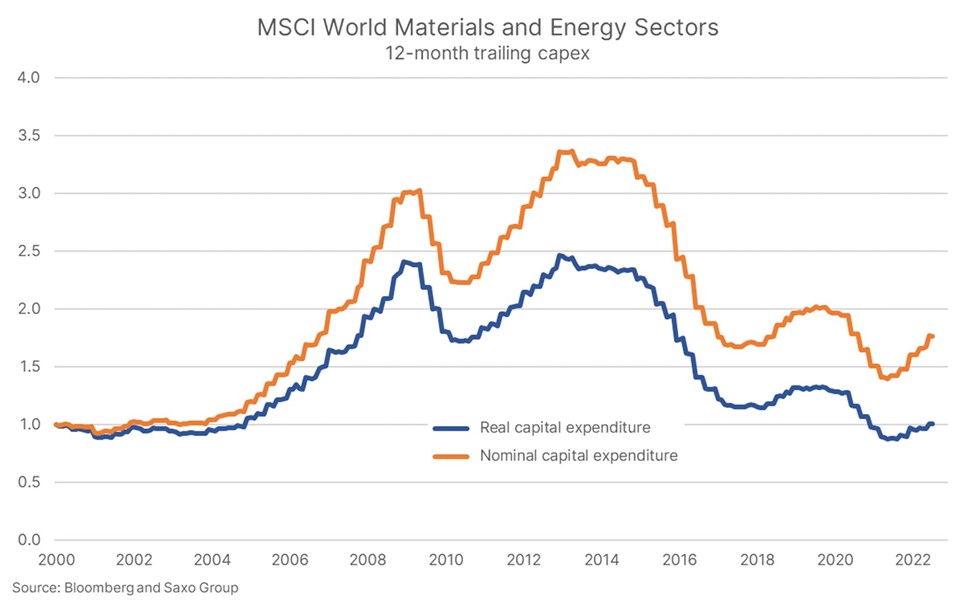
Ole Hansen Head of Commodity Strategy at Saxo Bank believes this lack of investments in materials and energy sectors, as depicted below, together with the forces of decarbonization, electrification and urbanization will keep supply tight and inflation high.

At a minimum, investors should consider the possibility of a new Commodity Super Cycle.  The key matter of debate is whether investors believe the Federal Reserve will ultimately be successful in taming the inflation beast.  The Fed is playing catchup after letting the beast run wild for some time before taking credible action.  For a more in-depth discussion on the Fed’s chances of policy success, readers are encouraged to watch investment research firm Real Vision’s video where perspectives on both sides of the economic debate – deflation/disinflation/recession and inflation/stagflation – are discussed.

We’ll be watching for signs that the Federal Reserve’s interest rate hikes and quantitative tightening cycle are having the desired economic impact – the destruction of demand for goods and labor.  One factor we’re highly focused on is the labor market and whether unemployment levels will trend higher and if inflationary wage pressures lessen.  Secondly, we’re watching for signs of a possible Federal Reserve policy mistake, like a premature policy pivot before the back of inflation is broken.

Our preferred investment vehicle for a tactical allocation to commodities is the Invesco Optimum Yield Commodity Strategy No K-1 ETF (PDBC).   PDBC is an actively managed exchange-traded fund (ETF) that seeks broad-based commodity exposure through financial instruments (commodity futures and swaps and U.S. Treasury Bills) that are economically linked to the world’s most heavily traded commodities.  The Fund’s commodity allocation is production weighted and therefore structurally overweights the energy complex relative to other commodity indexes.  The following summarizes commodity allocations (current % and strategic rebalance target %):


Sector

Current % Allocation

Strategic Rebalance Target %

Commodity Allocation

Energy 63% 55% WTI Crude, Brent Crude, Natural Gas, Gasoline
Precious Metals 8% 10% Gold & Silver
Industrial Metals 9% 13% Aluminum, Copper, & Zinc
Agriculture 20% 23% Corn, Soybeans, Sugar, Wheat


PDBC outperformed GSG in 2021 returning 41.9%, but the Fund is lagging that GSG year-to-date at 20.7% in gains through October 26, 2022.  Importantly, the Fund does not generate a K-1 tax reporting obligation.

Clear signs of an impending Fed policy mistake would lead us to aggressively consider a tactical allocation to commodities through PDBC.  One low-probability scenario would be a significant dislocation or lack of market liquidity in the U.S. Treasury market that forces the Fed to purchase treasuries.   The Fed would effectively be adopting yield curve controls, much like the recent Bank of England’s actions in the gilts market to stem an uncontrolled blow-out of gilt yields.  One expected casualty in this outlier fact set would be foreigners’ loss of faith in the U.S. Dollar with an ensuing currency devaluation like in the 1970s when Nixon ended dollar convertibility to gold.
Re-Evaluating the Role of Gold in Investment Portfolios

2022 has proven to be a particularly interesting and bumpy ride for investors as we travel the economic path toward the end of our rainbows and the achievement of our long-term savings and investment goals. Recent monetary policy and global events have investors reconsidering what role gold plays in a modern investment portfolio. Diversification into inflation hedging assets, such as gold, will be a key consideration for investment portfolios to manage the inflation bumps and monetary policy U-turns. In many respects, the market has indicated early in 2022 that what may be the key to surviving this rocky economic road is by looking ahead to what’s at the mythical end of the rainbow: a pot of gold. 

Gold Rush

What do today’s investors and gold prospectors from the 1800s have in common? They are both rushing to get their hands on gold. Inflation woes and market uncertainty have rightfully sent the gold market into a frenzy as investors seek its real asset protection. As of April 25th, gold’s value is up around 10% from the previous year and is up 22.8% since right before the pandemic began in March 2020. While it has given up some gains in recent weeks, it still has strong year-to-date returns. Frankly, gold has been a sparkling investment since 1999 when its price averaged around $252.50 per ounce. Today, gold is trading at closer to $1,900 per ounce, creating a strong upward trend over the last 23 years. Gold reached an all-time high on March 9th when the price of the “barbarous relic” topped out at $2,053.60. Volatility still plagues the real asset but for gold investors who have buried American Eagle coins, gold bars, or equivalents in their safety deposit boxes or investment portfolios, the reward has paid off.

Speculators have questioned whether this gold rush will continue throughout 2022. To be certain, gold prices will be very dependent on what happens with inflation, interest rates, and the Russian/Ukrainian conflict.  The barbarous relic’s bullish trends are currently projected to continue throughout 2022 but even the most optimistic investors will continue to keep an eye on its volatility because as we have experienced “All that glitters is not gold.” – William Shakespeare.

Gold Performance During Economic Crisis & Inflationary Pressure

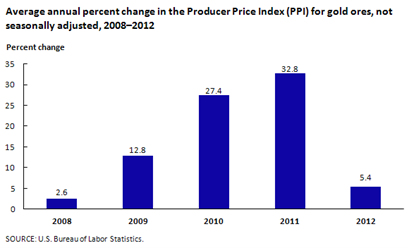
Real assets such as gold or real estate like farmland have often been favored during times of economic crisis and global uncertainty since fiat money printing becomes global governments’ default solution. Investors flocked to real assets during The Great Inflation of the 1970s when unemployment levels were high, and the economy was turbulent. We saw similar circumstances during the 2008 Global Financial Crisis. Initially, gold also faced considerable volatility in 2008 as investors sought liquidity across all investment holdings.  After the initial shock of the financial crisis, people bought gold when they sensed that the money printing had started in earnest. Growth slowed down in 2012 as the Federal Reserve lowered interest rates and a weaker dollar resulted. The figure below shows the annual price movements of gold during this time period.

Source: U.S. Bureau of Labor Statistics

              The most recent notoriety surrounding gold has understandably been driven by its relationship with inflation. Recently inflationary numbers accelerated with CPI growing more than 8% year over year and the narrative has flipped from “transitory inflation” to “secular inflation” and there is a growing concern for stagflation (slow economic growth with high inflation). The Federal Reserve has reversed course and dropped its inane “transitory” policies and is aggressively raising interest rates to temper demand and combat rising prices. However, with supply chains still recovering from the COVID-19 pandemic, the Russian/Ukraine conflict has thrown another wrench into global economic gears as the market for commodities, such as oil, gas, and grains grows more fractured.

What does all of this have to do with Gold? Well, this considerable market uncertainty has investors accumulating real assets and gold because of its historical positive correlation. In the past, as inflation levels have risen so has the price of gold. We discussed this dynamic in more detail in our February insight. Gold’s positive correlation with inflation has continued to hold in 2022 with gold prices peaking just as investors are seeking protection from high inflation.  The following table shows the correlations of various asset classes, including gold, to Consumer Price Index (CPI).

Historical Correlations of Financial Assets with Inflation (1970-2020)

Source: Data supplied by the TIAA Center for Farmland Research

Gold’s Performance in an Investment Portfolio

Gold can play a valuable role in an investment portfolio not only for its inflation hedging capabilities but also for its historical negative correlation with bonds and equities given its safe-haven attributes in times of war and geopolitical turmoil. Some investors argue that gold is unattractive within an investment portfolio because of its volatility and inability to produce an income stream. However, asset allocators and investors might be rethinking portfolio construction as recessionary fears persist and U.S. stock indices continue their volatile fall. The S&P500 is down –11.25% year to date with the NASDAQ and Dow Jones also posting similar losses for the period of -18.05% and -6.14%, respectively. In contrast, gold is up close to 4% year to date and investors are aggressively rethinking their portfolio diversification strategies.

Source: Q1 Market Commentary

              There are a variety of alternatives for investors to gain exposure to the gold market.  The most obvious is buying gold coins or bullion directly and storing them in a secure vault at a financial institution. Buying gold directly is unlikely to be the best option for many investors due to the high frictional cost of storage and security for the physical asset. Another option would be to invest in the supply chain for gold such as gold miners. Barrick Gold Corporation (GOLD) is the largest gold company in the world. The Toronto-based company mines, processes, and has reserves across five continents. Its stock price is up 7% year over year.  A more diversified gold mining play is the VanEck Gold Miners ETF up 20% year over year.  For investors seeking less direct gold exposure but still scouting for inflation protection, Horizon Kinetics Inflation Beneficiaries ETF (INFL), offers broad diversification benefits. We wrote about INFL in February when it was added to the Servant Financial portfolio. It currently has $896 million in assets under management with holdings in gold and other mining companies, energy and food infrastructure, and transportation: all sectors that have experienced some of the most positive price movements in the underlying commodities or products and services.

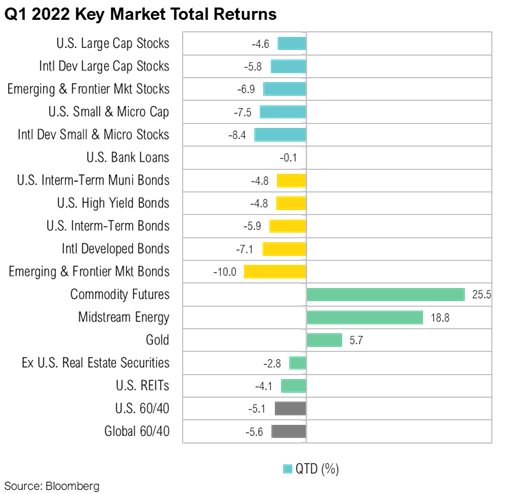
Traditional investment theory cites the most prevalent portfolio benchmark is a 60/40 split in an

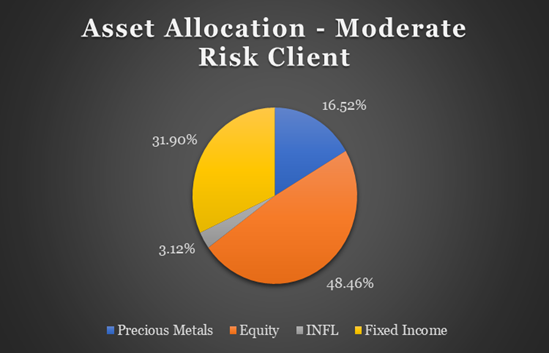
investment portfolio with 60% equities or stocks and 40% fixed income instruments or bonds. Under this portfolio model, investors would be down -5.6% quarter to date as both U.S. stocks and bonds were hammered by rising inflation. The performance of the traditional 60/40 portfolio compares unfavorably with Servant Financials’ sample moderate risk client. The Servant model portfolio also holds a diversified mix of global equities and bonds but also includes a healthy allocation to precious metals. This inflation-protected model portfolio was down only -0.57% quarter to date. See the accompanying asset allocation chart.

Within this Servant model portfolio, INFL had total returns of 8.8% for the first quarter of 2022, Berkshire Hathaway Class B shares (+17.6%), Farmland Partners Inc shares (+14.6%), and various precious metal investments (GDX +19.0%, Sprott Gold & Silver Trust +8.9% and iShares Silver ETF +7.2%) accounted for the bulk of the favorable performance variance to the traditional 60/40 benchmark.

We will continue to monitor the performance of gold and other inflation hedges and adjust asset allocation as we chart the optimal path to the achievement of your long-term savings and investment goals. If you would like to discuss your financial situation and how to secure that pot of gold at the end of your investment rainbow, please contact us at john@servantfinancial.com.

Going, Going, Gone! Is Inflation Running Away with our Money and our Investment Returns?

On the field that is the U.S. economy, currently loading the bases are looming interest rate hikes, the value of the U.S. dollar, and rising Treasury yields. On the mound, is Federal Reserve Chairman, Jerome Powell, and everyone from investors to consumers are waiting to see what will happen next with monetary policy and the economy. Early in the game, the COVID-19 pandemic threw a curveball, and ever since, the economy has been dribbling a series of weak grounders from persistent unemployment, to supply chain disruptions and a declining labor force participation rate. Will Chairman Powell toe the rubber to strike out runaway inflation and imperil economic growth or is the US economy in for extra innings?

How did inflation get so out of hand?

The U.S. Bureau of Labor Statistics reported that in January 2022, the consumer price index rose 7.5% from January 2021, the highest rate of inflation since February of 1982. Some of the industries seeing the largest price hikes are the energy, gasoline, housing, and food sectors which is of no surprise for anyone who has bought groceries or visited the gas pump lately. Even with the rise in prices, it hasn’t generally stopped consumers from spending. The Commerce Department reported that retail sales are up 3.8% year over year with large gains reported in vehicle, furniture, and building supply purchases. Home sales have been on the rise as well with the National Association of Realtors citing that home sales in January were up 6.7% from the previous month. This comes as home buyers are trying to secure financing at lower interest rates before the anticipated Federal Reserve rate increase next month.

Source: SpringTide US. Inflation Trends

While this level of inflation is unlike anything Americans born after the 1970s and early ‘80s have ever experienced, many economists are not surprised by this spike in the CPI. The federal government has shelled out more than $3.5 trillion in COVID-19 relief funding in the form of stimulus checks, unemployment compensation, and the paycheck protection program. The figure below shows the allocation of this spending with more spending earmarked through 2030 as the government continues to combat the aftershocks of the pandemic. The excess liquidity in the market, combined with the supply chain disruptions and labor shortages, has created the perfect cocktail for inflation to brew. While this spending was necessary to keep the economy out of a recession, some argue the federal reserve hasn’t been aggressive enough in unwinding its pandemic era policies to combat rising inflation. The Federal Reserve has announced that rates will start to rise in March, but by how much? Experts, such as economists at Citibank, are predicting anywhere from a 25 to 50-basis point hike with the later end of the spectrum becoming more likely as inflation rises. They are then expecting three to four more 25-basis point hikes by the end of 2022. Economists feel this could help slow inflation by the end of the year, but supply chain disruptions and incipient wage inflation risk still loom.

Source: CNBC analysis of Treasury data compiled by the Pandemic Response Accountability Committee

Is 2022, the new 1980?

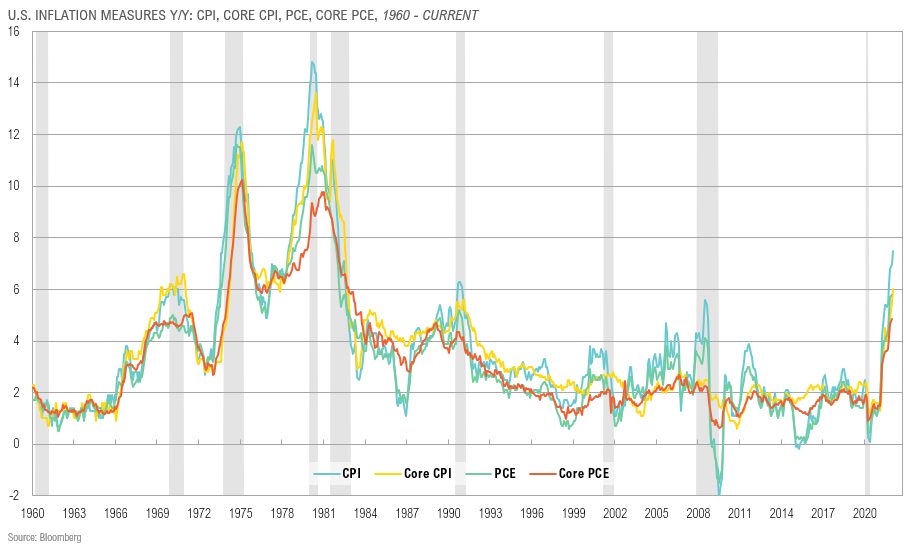
The survivors of the last battle with inflation in the 1970s and 80s know all too well what runaway inflation looks like.  It has some questioning whether we are in for a blast from the past in 2022. Inflation peaked in 1980 at 14.8% and while we haven’t hit those levels yet, the jump we have experienced has people on their toes for a line drive heading for them. Inflation in the ’80s was driven by a variety of factors from unpredictability in interest rates to soaring oil prices. Most economists believe that this time is different than the 1980s as recent inflation has been caused by COVID-19 aftershocks of excess liquidity and supply chain issues. These factors are expected to normalize over time.

Examining our Investment Strategy

Markets have been off to a shaky start in 2022 with inflation and geopolitical risks in Russia & Ukraine driving the recent volatility. Economists and investors worry that if war broke out between Ukraine and Russia, it could cause more supply chain disruptions of commodities which could prolong inflation. While the Federal Reserve’s announcement of a March interest rate increase has curbed some concerns about more inflation, these new geopolitical risks could overshadow efforts to reduce inflation through monetary policy. As a result, investors are watching markets closely in addition to exploring inflation-protected physical assets such as gold or farmland. Below is the historical correlation between several asset classes and the consumer price index using returns data from 1970-2020. The CPI has historically had a positive relationship with bonds and precious metals but a negative relationship with equities.

Source: Data supplied by the TIAA Center for Farmland Research

Physical assets such as precious metals and farmland have taken center stage the past few months with gold values up 5.3% year to date and farmland values up 22% in parts of the Midwest since this time last year. While these physical assets have been investors’ go-to during high inflationary periods in the past, investors have also been allocating more of their portfolios to cryptocurrencies as well. Cryptocurrencies have a relatively short history compared to traditional assets which makes it difficult to analyze their performance with inflation, however, some investors are calling it “digital gold.” Even Mr. Wonderful, Kevin O’Leary, claims that his portfolio has more holdings in cryptocurrencies now than gold. Crypto enthusiasts cite its ability to be shielded from the effects of government money printing and spending largesse.

Servant Financial has been keeping tabs on inflation and has updated its investing strategy accordingly based on investors’ risk tolerance. While we are still allocating a portion of portfolios to equities and fixed income instruments, we’ve had a higher portfolio tilt towards allocation to precious metals, real assets, and Grayscale Bitcoin Trust (BTC) as protection for client portfolios from inflation. INFL, Horizon Kinetics Inflation Beneficiaries ETF, has recently been added to the portfolio as well. It is an actively managed ETF designed to capitalize on growing inflation trends. Currently, INFL has $896 million assets under management with holdings in transportation, financial exchanges, energy and food infrastructure, real estate, and mining companies. While INFL has a diverse group of global holdings, its top holdings are in PrairieSky Royalty (Oil & Gas), Archer Daniels Midland (Food & Agribusiness Processing), and Viper Energy Partners (Oil & Minerals).

While inflation has threatened investors’ portfolio returns, an adjustment in investment strategy for the purposes of inflation hedging will help investors score in the performance game in the later innings of this economic cycle. A watchful eye must be kept on key economic signals such as changes in interest rates, inflation trends globally, and the supply chain normalization. If you would like to discuss your asset allocation so you can do well in all facets of the investment game like the alert and observant Willie Mays, the Say Hey Kid (Say who. Say what. Say where. Say hey.), contact Servant Financial today.

white-arrow