
When the Statue of Liberty was unveiled in 1886, she stood as a shimmering copper guardian — a literal embodiment of Dr. Copper long before the nickname existed. Her outer skin consists of roughly 176,000 pounds (about 88 tons) of hand-hammered copper sheets, just 3/32 of an inch thick — roughly the thickness of two pennies. That copper, meticulously shaped by French artisans, originally gleamed a bright reddish-brown. Over decades it developed its iconic green patina, a natural protective layer that has guarded Lady Liberty for nearly 140 years.

Today, as we stand on the cusp of a new multi-decade commodity super-cycle driven by Artificial Intelligence (AI), electrification, reindustrialization, and defense needs, Lady Liberty reminds us of copper’s enduring power. She is quite literally our Copper Beauty — a symbol of resilience, transformation, and the raw materials upon which great nations are built.
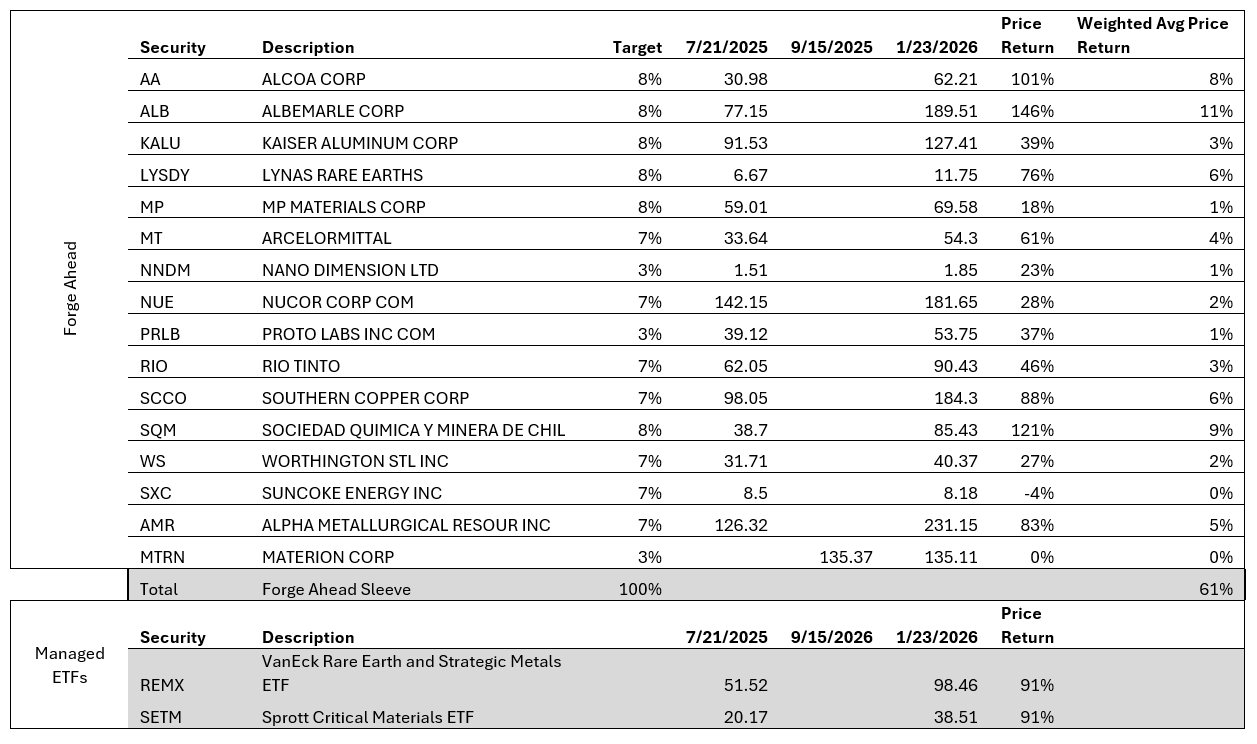
In an era where humanity must mine as much copper in the next 18 years as it has in the previous 10,000, her story feels more relevant than ever as America approaches its 250th birthday. Given recent price action in the metals complex, we revisit our Forge Ahead critical minerals investment thesis through the lens of Dr. Copper and Lady Liberty. Copper earned its moniker “Dr. Copper” because it is widely viewed as a leading indicator of global economic health — famously said to have a “PhD in economics”.
Key Price Changes in the Metals Complex (Late May to June 26, 2026):
- Gold: ~$4,087/oz — down 8.3% over the past month (from ~$4,463 in late May). It had hit all-time highs above $5,600 earlier in 2026.
- Silver: ~$58.78/oz — down 20.9% over the past month. It peaked above $121 in January 2026 and has lost roughly half its value from those highs.
- Copper: $6.14/lb — down only 2.6% over the past month. It hit an all-time high of $6.67/lb earlier in June and remains strongly higher year-over-year.
- Aluminum: Down 11.8% over the past month.
These moves follow massive rallies across the complex in 2025 and early 2026, fueled by geopolitics, central bank buying (especially gold), supply concerns, and expectations of easier monetary policy.
What Are These Drawdowns Signaling?
We believe these corrections are driven primarily by macro repricing rather than any collapse in the secular fundamentals underpinning our Forge Ahead thesis.
- Copper has remained relatively resilient, holding near multi-week lows but well above earlier levels. This reflects ongoing structural demand from AI data centers and power infrastructure, electrification, renewables, and grid modernization.
- Aluminum’s larger drawdown highlights its greater sensitivity to cyclical growth concerns and risk-off sentiment. A true broad economic slowdown would likely pressure copper far more significantly.
- The market appears to be pricing in a lower geopolitical risk premium following de-escalation and containment around the Middle East conflict in recent weeks. The outbreak of the conflict had boosted safe-haven demand for gold and silver earlier in 2026.
- A stronger U.S. dollar and more hawkish Federal Reserve — reinforced by strong jobs and inflation data, new Fed Chair Kevin Warsh’s hawkish tone, and rising rate hike odds — have weighed on non-yielding assets.
Supply/demand fundamentals for copper and other critical minerals remain structurally supportive longer-term. Ongoing deficits, tight inventory balances, and chronic underinvestment in new mine supply have not fundamentally changed, even if they are currently overshadowed by macro noise. Metals markets can swing quickly; we continue to monitor U.S. dollar strength, Fed rhetoric, China demand data, and any geopolitical re-escalation.
To that end, we turn to the structural imbalances for Dr. Copper through the eyes of Dan Dreyfus of Bornite Capital. Dreyfus recently presented his views on critical minerals at the All-In Liquidity Summit. He sees a structural demand shock — reindustrialization, AI, electric vehicles, and defense needs — colliding with a multi-decade supply shock from chronic underinvestment. This sets the stage for a long-term secular commodity cycle, not a short-term trade. Copper, he argues, is the cleanest expression of the Forge Ahead thesis.
Key points from Dreyfus’s presentation include:
- Humanity mined roughly 700 million tons of copper over 10,000 years. Forecasts suggest we will need another 700 million tons over the next 18 years — requiring five new tier-one mines coming online annually, despite permitting and development timelines of 7–12 years. He expects copper prices to at least double.
- Trillion-dollar capital cycles are underway across aerospace (backlog >$1 trillion), the aging electric grid, data centers (~$1 trillion per year), semiconductor fabs (~$750 billion per year), and rising defense spending — all dependent on critical minerals production and refining, areas where China holds dominant control.
- The durable chokepoint is processing and refining capacity, not raw ore. U.S. efforts to catch up could take 10–20 years even with strong Department of Defense and Energy Department support.
- Silver faces a ~200-million-ounce annual deficit against roughly 600 million ounces of above-ground inventory, raising the prospect of a credible stock-out within about three years.
- A widespread shortage of skilled craft labor represents an under-appreciated bottleneck across the entire critical minerals sector.
- Investment implications favor exposure to copper, silver, other critical minerals, associated service providers, skilled labor plays supporting U.S. reindustrialization, and hard assets as a hedge against inflation.
- Copper intensity has risen sharply: solar uses 5× more copper per megawatt than natural gas, wind 7× more, and EVs 5–6× more than internal combustion engines.
As Lady Liberty continues to stand watch over New York Harbor — her once-bright copper skin now protected by a green patina — she offers a powerful metaphor for the moment we find ourselves in. Just as her copper has endured and transformed over nearly 140 years, Dr. Copper and the broader suite of critical minerals are entering a new era of structural importance. The forces Dan Dreyfus outlined point to a multi-decade opportunity.
In Forge Ahead: Dr. Copper’s Enduring Legacy, From Lady Liberty to Tomorrow’s Tech, we see both the historical symbol and the forward-looking investment case. Copper’s resilience amid recent macro volatility, combined with powerful secular tailwinds, reinforces why we remain constructive on the metal — and the critical minerals complex more broadly. The green patina may have changed her appearance, but the strength of her copper core remains. So too does the case for forging ahead.
Servant Financial wishes you all a safe celebration of America’s 250 years of Independence on the 4th of July – Life, Liberty, and the pursuit of Happiness.