Email us at info@servantfinancial.com to talk to a financial advisor today!

Email us at info@servantfinancial.com

Where Have All the Good Workers Gone?

Reminiscent of the 1984 Bonnie Tyler hit from Footloose, many US employers are crooning for working class heroes. “I need a worker, I’m holding out for a worker ‘til the end of 2023.” The U.S. labor force has been dwindling from food and beverage service to financial analysts since the COVID-19 pandemic began. While some have been quick to blame the shortage on several rounds of government relief money that idled some workers, a combination of factors is influencing this labor change. Millions of people were suddenly unemployed at the start of the pandemic and many industries assumed these people would return to work when normalcy resumed. However, almost 3 years after the start of the pandemic, these “missing” workers may never return to the labor force. This labor shortage could cause a secular shift in American businesses and labor markets.

COVID-19
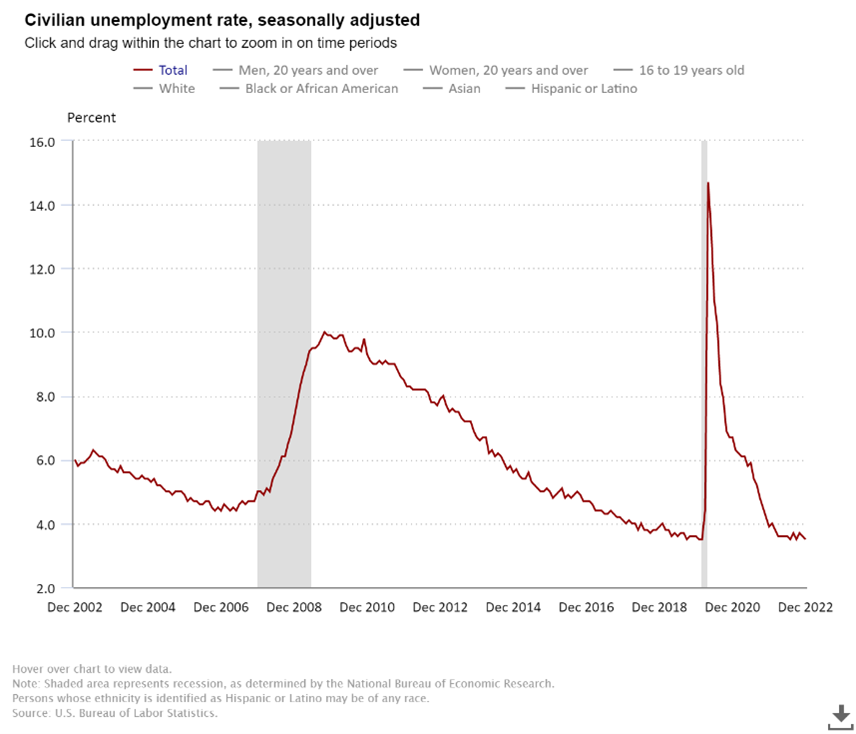
Government and businesses’ responses to COVID-19 brought about a 50-year high in unemployment, peaking at 14.7% in April 2020. Service workers and business professionals found themselves suddenly without work and wages. The U.S. government came to the rescue, handing out $5 trillion in pandemic stimulus money with a large portion devoted directly to individuals in the form of stimulus checks and extended unemployment benefits. When evidence of a growing labor shortage emerged, many people pointed fingers at the U.S. government for providing so much monetary support and disincentivizing workers to return to the job market. However, the story isn’t that simple. Fears of contracting and spreading COVID and the existential risk of mortality created a widespread shift in lifestyle priorities and an increased desire for a better work-life balance. The result of these factors has been the rise of remote labor and gig workforces. A study done by the U.S. Chamber of Commerce found 91% of survey participants hoped they could continue to work remotely at least part of the time. Businesses have generally adapted to this desire and been accommodative.  However, remote labor isn’t really a possibility for customer-facing service roles or manufacturing jobs for which labor activities are concentrated in a single location.

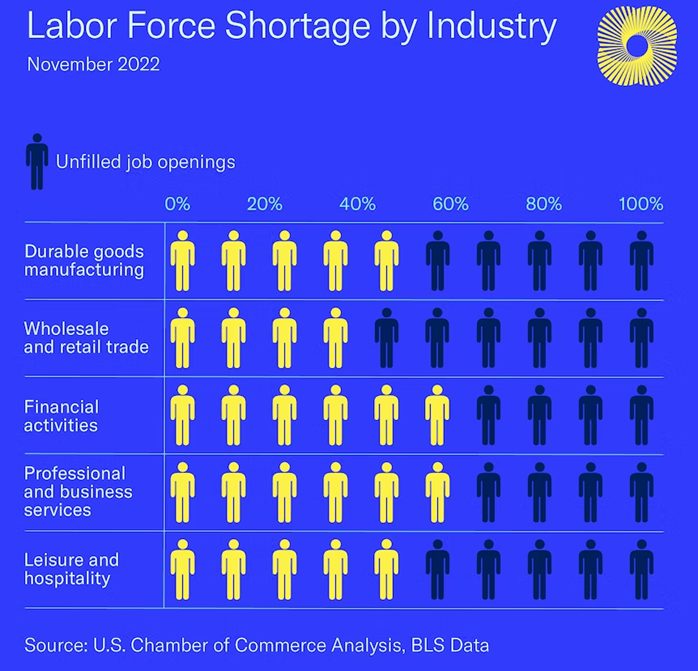
The U.S. Labor Department reported 10.5 million job openings in November 2022 with the labor participation rate at 62.3%, down from 63.3% in February 2020. Not only do service industries have their “Help Wanted” signs out but so do financial services and professional and business services. While workers are demanding more remote work, these professional industries are demanding people come back to work in their office buildings to collaborate with their colleagues. Workers have been less receptive to this return to the office mandate causing worker turnover rates to reach 57.3% in 2021, up from 45% just two years earlier. Businesses that have been able to accommodate their workforce’s desires for at least partial remote work are generally experiencing lower turnover and avoiding severe labor shortages.
No More Baby Boomers

Economists argue that this labor shortage was always on the demographic table. The labor participation rate has been on a downward trend since 2000 and some argue it is as simple as the laws of supply and demand. One of the largest generations in U.S. history, the Baby Boomer generation, is clocking out with no plans to punch back in. The median age of the Baby Boomer generation (born 1946-1964) turned 66 last year meaning many boomers are taking a refrain from Johnny Paycheck’s 1977 hit song, “Take This Job and Shove It” and checking into retirement. The next generation behind the boomers, Generation X, is about 5 million people short to fill the employment hole the boomers are leaving. The next generation able to take the Boomer’s place is the Millennials; however, it is still going to be several years before they enter the labor force. COVID-19 only intensified Boomers leaving the workforce as older generations were more susceptible to adverse outcomes from the virus. Boomers were also less likely to adapt to changes toward more remote work.  This trend may have something to do with the adage of old dogs and new tricks.
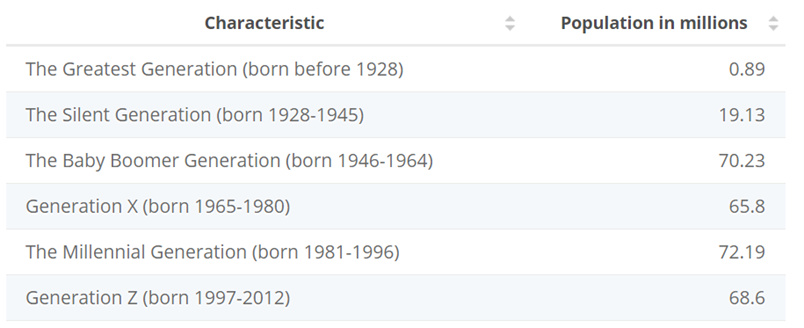
Source: Statista

These trends in labor demographics are not likely to be resolved any time soon as the World Bank projects the number of people between the working ages of 15 and 65 is set to decline by 3% over the next decade. “Without sustained immigration or a focus on attracting workers on the sidelines of the labor force, these countries simply won’t have enough workers to fill long-term demand for years to come,” said the chief economist at Indeed. Historically, immigration and globalization have helped bridge the labor gap; however, during the pandemic we saw a reversal of both trends. Policy reform towards immigration will need to happen if the U.S. wants a sufficiently dynamic labor force in the years to come.

Is the End in Sight?

The question begs, how long will this domestic labor shortage last? While a body of evidence suggests this is a systematic change, other economists argue a potential shift into a recession could help lower demand for labor and bring the labor situation towards equilibrium. The shifting landscape of the U.S. economy toward a recession would likely reduce hiring levels as companies are forced to cut back on growth plans. While we may see an uptick in unemployment levels, it is doubtful it will reach the near 10% unemployment levels the Great Recession of 2008 brought. The looming recession and persistent inflation point to a normalization of the labor market in 2023; however, some companies are still going to need to make adjustments to their business models to compensate for the loss in workers.

Companies are beginning to readjust their hiring strategies and their job expectations to accommodate the current labor market conditions. Inflation has made it difficult for companies to keep pay scales in line with the cost-of-living increases. It is going to be increasingly important for companies to be proactive with their employment strategies and stay ahead of the trends in worker lifestyle demands if they want to retain good talent. Companies such as IBM (Ticker: IBM) predicted this shortage long ago and began outsourcing their talent to countries with growing populations such as India. They have been able to capitalize on lower market-based wages in these developing countries and cheaper input supplies.

Meanwhile, the technology sector is busily working on solutions to these labor shortages, like artificial intelligence and machine learning.  The most recent market hero in this space is ChatGPT from the venture firm OpenAI.  ChatGPT optimizes language models for dialogue. The ChatGPT model has been trained to interact with users in a conversational way. This format makes it possible for ChatGPT to answer follow-up questions, admit its mistakes, challenge incorrect premises, and reject inappropriate requests. Several in the Twittersphere claim that ChatGPT has passed portions of the Bar Exam, medical license exam, and MBA operations exam. Further, experts interviewed by UK’s Daily Mail believe ‘AI will take 20% of all jobs within five YEARS’ and explain how bots like ChatGPT will dominate the labor market. According to the article, Microsoft invested $10 billion in ChatGPT and said that the technology will change how people interact with computers.

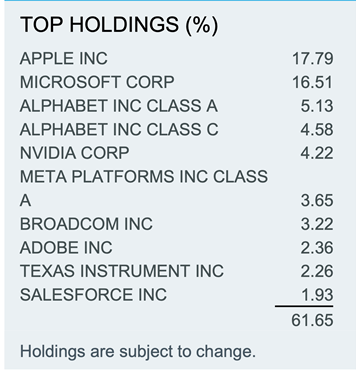
From our standpoint, the best way for investors to express a purposeful view on the future emergence of artificial intelligence and machine learning is through the leading technology heros, like Microsoft and Apple, who have massive distribution capabilities through their existing software and hardware product suites and business relationships across sectors. We like iShares U.S. Technology ETF (IYW).  This ETF provides exposure to the leading U.S. electronics, computer software and hardware, and IT companies.  IYW’s boasts assets under management totalling $7.8 billion and a reasonable expense ratio of 0.39%.    IYW has traded down 35% in 2022 and trades at an estimated 2023 price to earnings ratio of 23 times.  The following summarizes IYW’s top holdings:
We recommend buying IYW on future weakness and sitting on the sidelines holding out for a hero ‘til the morning light. In other words, wait until the next recession and buy these tech heroes who are strong, fast, and fresh from the fight.

Almighty Dollar

Current Status of US Dollar

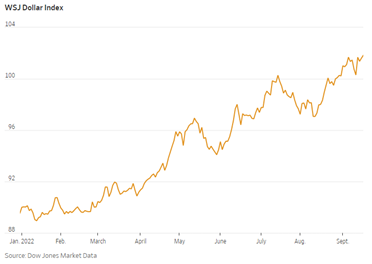
What do George Washington, Abraham Lincoln, and Benjamin Franklin have in common? These three American icons found on the $1, $5, and $100 bills have been getting much stronger the past several months. The U.S. dollar is undergoing one of the longest periods of almost steady appreciation in several decades impacting domestic and foreign economies alike. The ICE U.S. Dollar Index, the most widely adopted currency index, measures the international value of the US dollar against other major fiat currencies with a weighting of Euro (58%), Japanese Yen (14%), British Pound (12%), Canadian Dollar (9%), Swedish Krona (4%), and Swiss Franc (4%). The buck’s value is currently up 22% since the start of 2022 with little end in sight.

Source: Wall Street Journal

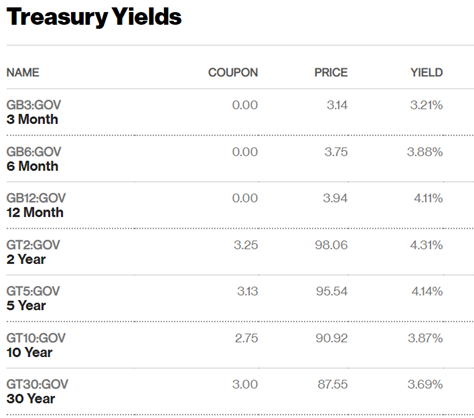
The rise in the dollar’s value is unsurprising as record inflation in the United States has prompted the Federal Reserve to aggressively raise interest rates over the past several months. Just last week, the U.S. central bank decided on another .75 percentage point increase, the third consecutive rate hike. This pushed the implied Fed funds curve higher, with terminal Fed funds now expected to peak at 4.6% and remain above 4.0% through the end of next year. The yield curve inverted further with the 2-year versus 10-year treasury spread at 50 basis points (0.5%).  These changes in the risk-free U.S. treasury rates are driving the cost of capital higher for all risk assets and significantly impacting equity and currency markets. While the stock market has experienced significant losses, the dollar has been benefiting from increased capital flows due to rising treasury yields. The U.S. 10-year treasury note is at a multi-year high, yielding over 3.5%. Rising U.S. interest rates have foreign investors flocking to higher-yielding U.S. treasuries and pulling capital out of lower yielding, perhaps riskier currencies, bond and equity investments in other countries. This trend is particularly visible in energy dependent jurisdictions like the European Union, China and Japan.

Impact of the US Dollar on the Global Economy

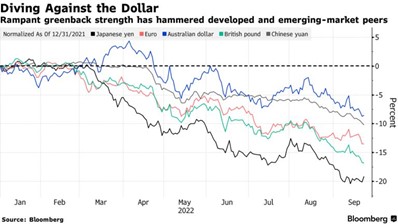
Efforts to combat inflation through interest rate hikes have been counteracted by the strengthening dollar, fueling cheaper imports for the American people. However, the rest of the world has felt the brunt of this change. The economies being hit hardest by the punch of the U.S. dollar, are some of the U.S. largest trading partners: China, Japan, and Europe.

On September 26th, the British pound hit its lowest value ever against the U.S. dollar, sending U.K. bond yields soaring. Emerging economies have also declined in value relative to the dollar with currencies in Egypt, Hungary, and South Africa falling by 18%, 20%, and 9% respectively.

Not only are rising U.S. interest rates impacting these economies, but geopolitical concerns between Ukraine and Russia have Europe in an economic war of its own with Russia. Combined with surging inflation and the aftershocks of the COVID-19 pandemic, the war between Russia and Ukraine has Europe in an energy crisis, only furthering their currencies’ devaluation. Energy prices have skyrocketed while supply dwindles as Europe, particularly Germany, was very heavily dependent on natural gas imports from Russia for its global manufacturing base and winter heating. As European countries are forced to look to the U.S. and other markets for alternative oil and gas imports, the devalued Euro currency is only deepening the economic damage as most imports are traded in U.S. dollars.

Domestic companies with international operations are also being squeezed by the strong dollar. McDonald’s reported global revenue fell 3% this past summer while Microsoft stated that the changes in foreign currency values cut their revenues by close to 1% in the last quarter. According to a report by CBS news , companies comprising the S&P 500 receive 40% of their revenues from foreign countries. This has only added fuel to the downward spiral of the stock market as earnings expectations are lowered due to foreign currency translation losses and inevitable demand destruction. Domestic and foreign companies alike are pointing at the U.S. monetary policy as the root cause of the dramatic economic slowdown globally.

Investment Opportunities

In every market scenario there are winners and losers, and the current strength of the U.S. dollar is no different. While the U.S. stock market has entered a bear market with 20% declines across most major stock indices, treasuries and corporate bond yields have been on the rise in recent months as outstanding bond prices have declined in response to Fed interest rate hikes. Moody’s reports Aaa corporate bonds are currently yielding 4.65% which is up from 2.60% just a year ago while Baa bonds are currently yielding 5.78% on average, up from 3.26% a year ago.

Source: Bloomberg

The looming energy crisis in Europe has some adventuresome investors looking to clean energy options to capitalize on potential long-term secular growth. Even though the energy crisis is worse in Europe, the U.S. has still experienced stubbornly high oil, gas, and electricity prices over the past few years, contributing to the high inflation rate. Last month, we told you about the iShares Global Clean Energy ETF (ticker: ICLN) and the First Trust NASDAQ Clean Edge Green Energy Index Fund (ticker: QCLN) with assets under management of $5.5 billion and $2.4 billion, respectively. Each ETF has demonstrated strong 10 year returns and the government has deepened its commitment to clean energy through the Inflation Reduction Act, meaning this strong performance is likely to persist in the future.

One way to make a contrarian play on the strength of the U.S. dollar waning, or mean reverting over time, would be to invest in a basket of emerging market currencies which for the most part are energy and resource rich.  We explored these alternatives on Research Affiliates Asset Allocation Interactive website seeking a fixed income alternative that is expected to pay a real yield (nominal yield less expected U.S. inflation of 4.0%) and an attractive Sharpe ratio (return per unit of risk).  Perhaps the best alternative was Emerging Market Cash asset class.  As of August 31, 2022, Research Affiliates expects EM Cash to generate a real return of 2.4% (real return in excess of U.S. dollar cash of 4.6%, ie. real loss of (2.2%) holding U.S. dollar) with volatility of 7.2%. This compares to a real return of (0.4%) with volatility of 3.8% for U.S. Treasury intermediate bonds.  Of note, Research Affiliates’ risk and return metrics for the EM Cash asset class were derived using a variety of information, including using the J.P. Morgan ELMI+ index as a representative example.  Servant Financial portfolio models generally include an allocation to the J.P. Morgan EM Local Currency Bond ETF (EMLC).  EMLC yields over 7% and is comprised of mostly investment grade (72%) sovereign debt obligations in local currencies.  The top 4 currencies represent 38% of its holdings – Indonesian Rupiah (10%), Chinese Renminbi (10%), Brazilian Real (9%), and Mexican Peso (9%).

As you might expect, the price of EMLC has been declining in line with the U.S. dollar strength this year.  We rebalanced the model portfolio last week and at much earlier juncture in 2022 where EMLC was among the list of buys both times.  Rebalancing is a prudent investment practice whereby investors buy more of their losing positions and sell winners to get back to overall targeted asset class allocations. Research Affiliates recommends modest allocations to EM Cash of 2% to 4% in conservative to aggressive risk models.

Conclusion

2022 is turning out to be one for the financial record books as inflation, geopolitical pressures, and the bear market has George Washington, Abraham Lincoln, and Benjamin Franklin being stretched in every direction in our wallets. Global recession concerns are rising as the Federal Reserve’s high conviction battle with inflation is affecting consumers and markets all over the world. As participants in a global economy, we need to remember the words of the man found on the $5 bill. “The money power preys on the nation in times of peace and conspires against it in times of adversity. It is more despotic than monarchy, more insolent than autocracy, more selfish than bureaucracy. It denounces, as public enemies, all who question its methods or throw light upon its crimes.” -Abraham Lincoln.

The ubiquitous strength of the almighty dollar and resultant market mayhem suggest the Jerome Powell led Federal Reserve is currently playing the role of Lincoln’s “money power.”  The Fed is wielding economist Adam Smith’s “invisible hand” with brass knuckles as it tries to break the back of inflation.  The potential collateral damage of the Fed’s heavy-handed approach include the domestic and global economies, the credibility of the Fed, and the almighty dollar’s dominance as the sole global reserve currency.

Carbon-Nation: Intro to Carbon Markets

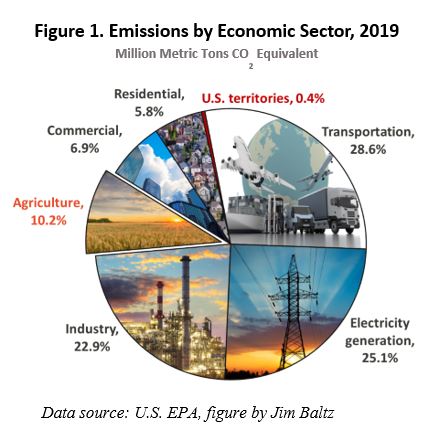
Although agriculture is the fourth leading source of greenhouse gas emissions (see Figure 1), agricultural land also has the unique ability to store carbon dioxide in soils, plants, and trees. Because of this unique ability, recently, there has been a lot of focus on agriculture as a way to reduce greenhouse gas emissions. One report suggests that U.S. agriculture and forestry sectors can provide 10-20% of the sequestration and emission reductions needed to reach net-zero emissions by 2050. Current carbon sequestration on U.S. cropland is 8.4 million metric tons of carbon dioxide equivalents  per year (“CO2–eq  per year”) and the estimated annual sequestration potential is 100 million metric tons of CO2–eq  per year (source).

When considering the chart of emissions by economic sector, we see the three largest emitters are the transportation, electricity generation, and industry sectors. These three sectors alone account for approximately 77% of the total U.S. greenhouse gas emissions. Reducing emissions in these sectors typically requires long-term changes. For example, a shift toward electric cars in the transportation industry or solar or wind power in the electricity generation industry requires infrastructure changes and technology shifts, which have long lead times. One advantage of agriculture is its ability to make changes relatively quickly compared to the other larger emitting sectors. Within one growing season, farmers can adopt a practice such as cover crops or no-till that sequesters significant carbon and reduces greenhouse gases.

Several traditional agricultural seed and input companies and emerging agricultural technology (“agtech”) companies have been working to quantify and monetize the environmental benefits of agriculture. These agtech companies have begun launching private agricultural carbon markets for farmers.   Farmers can enroll their acres and adopt new practices that sequester carbon in the soil such as planting cover crops, adopting no-till or reducing their tillage, or reducing their nitrogen application. The sale of carbon credits presents an opportunity for farmers to receive financial benefits from changing to more environmentally beneficial agricultural practices, although carbon prices offered to farmers may not currently be high enough to cover their cost of switching practices. Information about carbon markets can be opaque and challenging to navigate because each carbon company typically has a different structure for payments, verification, and data ownership.  Many farmers are skeptical of these unregulated, “market” based programs.


Why Now?

The increased interest agricultural carbon markets stems from President Biden’s Executive Order on Tackling the Climate Crisis at Home and Abroad from January 27, 2021. This order specifically mentions “America’s farmers, ranchers, and forest landowners have an important role to play in combating the climate crisis and reducing greenhouse gas emissions, by sequestering carbon in soils, grasses, trees, and other vegetation and sourcing sustainable bioproducts and fuels.” As part of this executive order, the USDA collected input from the public about how to encourage the voluntary adoption of climate-smart agricultural and forestry practices. Stakeholders were also requested to make specific recommendations to the USDA for an agricultural and forestry climate strategy. The result of this initiative is the recent announcement by the USDA to use the Commodity Credit Corporation (CCC) to invest $1 billion in funding for pilot programs that use climate-smart practices and develop methodologies and practices to accurately and efficiently measure the greenhouse gas benefits4.

Chicago Climate Exchange (CCX)

Previously, there was a greenhouse gas reduction and trading project for emission sources and offset projects that could also be used for agriculture. The Chicago Climate Exchange (CCX) was a stock exchange for emission sources and offset projects that traded carbon credits from 2003 to 2010 (source). Some ways farmers could participate in CCX were through soil best management practices (continuous conservation tillage and grazing land best management practices), methane capture and destruction, reforestation, and fuel switching. In 2009, the CCX had over 9,000 farmers and ranchers enrolled, covering 16 million acres (source).

One significant challenge the previous CCX platform faced was a greater supply of carbon sequestration practices than market demand, driving down the price of credits. Today, the situation and market structure may be completely different. One-fifth of the world’s largest publicly listed companies have announced net-zero emissions targets. Furthermore, the U.S. has also pledged to reach net zero emissions by 2050. Some companies who purchase agricultural goods may need to specifically reduce their scope 3 emissions, which are the indirect emissions contained in the goods. For example, if a company purchases corn, the scope 3 emissions are emissions that went into producing the corn, such as fertilizer and fuel. One example of a company who purchased agricultural carbon credits is Microsoft, who purchased $2 million in carbon credits from Truterra, a subsidiary of the U.S. farmer cooperative Land O’Lakes in 2021. The new policy initiatives and public sector investment in climate smart agriculture by the USDA may catatlyze the market for agricultural carbon credits by providing more regulatory structural certainty for the carbon market today compared to the past.

How Farmers Participate

The main way farmers participate in agricultural carbon markets is through private companies who help farmers produce, verify, and sell carbon offsets in a marketplace or directly pay farmers for adopting new practices. Some select agricultural carbon market programs are shown below:

These companies typically use an estimation model to estimate the change in a farmer’s soil carbon from adopting a new practice and then pay the farmer based on this change. Many companies also use periodic soil testing in conjunction with modeling to verify results. Typically, most companies are guaranteeing farmers a minimum of $15 to $20 per carbon credit, where a credit is equal to one metric ton of CO2–eq. Many carbon industry experts are projecting that price to go up to $30 per credit in the upcoming year based on projected demand growth for carbon.

Opportunities for Carbon Market Investment

Although there is not a specific investment offering for agricultural carbon markets yet, there are broad-based carbon markets available that could indirectly affect those who own and invest in farmland. The opportunity of landowners and farmers to participate in these private agricultural carbon markets could generate some extra revenue on the farm, especially if carbon credit prices increase. More broadly, there are already existing opportunities for farmers, landowners, and environmentally conscious investors to allocate capital to carbon allowance ETFs.

Regulators across the globe are experimenting with policies to try force a transition to more renewable energy sources while attempting to minimize the economic fallout.  One such policy tool is carbon taxation and the associated carbon credit (or allowance) market prevalent in the European Union (EU).  One carbon allowance allows a firm to emit one metric ton of CO2. These allowances are auctioned off by the governing body that oversees the emissions trading system (ETS) and major carbon emitters are forced to buy an allotment of allowances equivalent to their estimated CO2 emissions. As all carbon emitters in a particular region need to buy these credits, the market sets a price based on the demand for fossil fuels and the restricted supply of carbon allowances.

Major markets have been established for carbon allowances in Europe, the United States, Asia and Australia. In the aggregate, it is estimated that the total size of these markets has reached $600 billion in 2021. The largest market is the EU ETS, which governs the 27 EU member states plus Iceland, Liechtenstein, and Norway and accounts for 41% of the EU’s greenhouse gas emissions. There are four carbon allowance ETFs available at this time –  KraneShares Global Carbon Strategy ETF (KRBN) (link), KraneShares California Carbon Allowance Strategy ETF (KCCA), KraneShares European Carbon Allowance Strategy ETF (KEUA), and iPath Series B Carbon ETA (GRN).

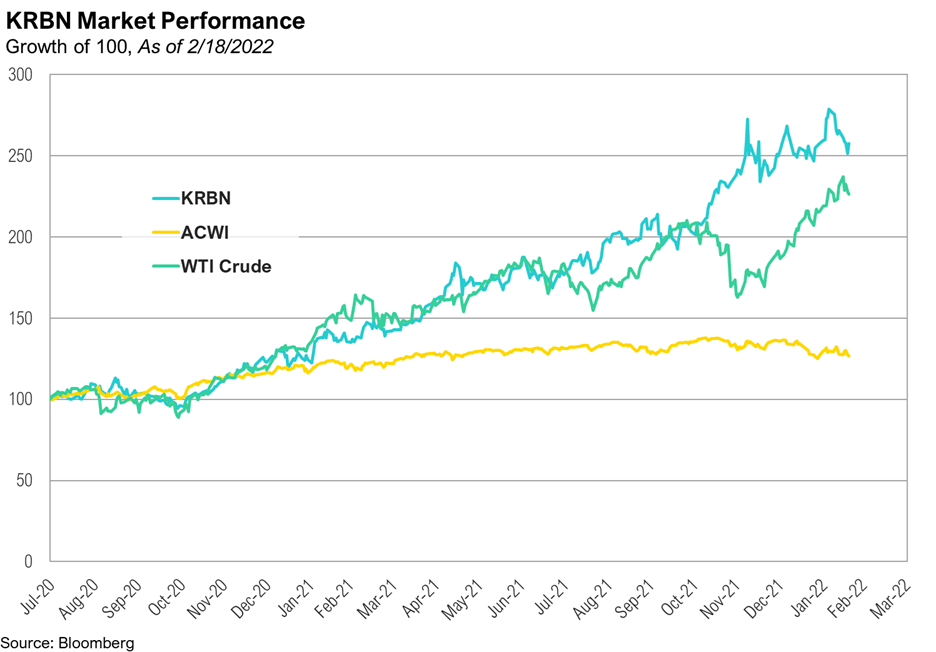
The largest and most liquid ETF KRBN tracks the major European and North American cap-and-trade programs (European Union Allowances (EUA), California Carbon Allowances (CCA) and the Regional Greenhouse Gas Initiative (RGGI) emission trading systems.  KRBN ETF’s assets total $1.8 billion.

The following chart summarizes the historical performance of KRBN ETF versus West Texas Intermediate crude (WTI) and All Country World Equity Index (ACWI).

Servant Financial has no formal recommendation on KRBN at this time given the volatile inflation and energy market dynamics and the Ukraine war.  In particular, the EU dependence on Russian oil and gas makes for a potential backdrop for easing of environmental standards to alleviate populous backlash on rising energy costs.  An allocation to KRBN may be a suitable consideration for more risk tolerant investors wishing to invest with purpose in an environmentally more sustainable planet for future generations.

white-arrow