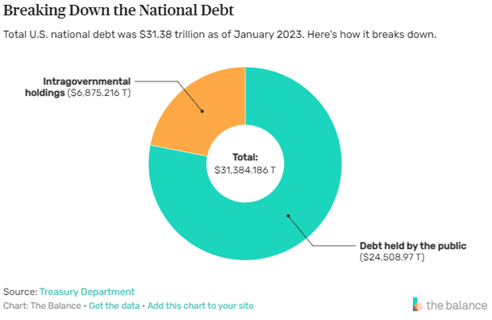


We are almost halfway through 2023 and economists, investors, and consumers alike are all wondering where the U.S. economy and their investment portfolios are headed. 2023 has been ripe with economic volatility. Inflation remains an issue globally. Supply chains are being reconfigured to mitigate vulnerabilities manifest during COVID-19 and to secure strategic resources leading to higher production costs. Meanwhile, geopolitical issues (war in Ukraine, trade sanctions against Russia) and government policy responses (sale of oil from the strategic petroleum reserve begetting OPEC/Middle East production cuts) have caused acute volatility in energy prices, first spiking upward in 2022 and then downward as global demand waned.
Earlier this year in the “Speeding Towards the E.R. – Economic Recession,” we discussed that we are likely on the brink of a recession occurring in the next six to twelve months which could have impacts on asset class performance and your investment portfolio. In this issue, we plan to review the current status of the U.S. economy and which asset classes to look to for outperformance as the likelihood of a recession grows. Some key economic vital signs cited in the previous article were inflation, Federal Reserve (Fed) monetary policy, bank instability, consumer spending and employment statistics. In this mid-year update, we’re going to take a page out of a Mark Twain novel and investigate his adage, “History doesn’t repeat itself, but it often rhymes” and review the current economic and market backdrop from a historical perspective.
High rates of inflation can have adverse effects on the economy as goods and services become more expensive. Rising costs of good, services and capital can slow GDP growth by destroying demand and reducing levels of production and employment. To combat chronically high inflation, the Federal Reserve has continued to raise interest rates. During 2023, after every Fed meeting, interest rates have been raised by 0.25%. The Fed’s current benchmark rate sits at roughly 5.00% – 5.25% which is the highest it’s been in the 16 years since 2007.
Meanwhile, the May inflation report showed the headline consumer price index (CPI) cooling to 4.0% year-over-year (vs. 4.1% expected) with core CPI (excludes volatile food and energy prices) coming in at 5.3% (vs. 5.2% expected). While headline inflation is easing substantially as we lap cycle-high energy prices last summer, we are in the 6th consecutive month with little change in core CPI, which has been stuck between 5.3% and 5.5% since January. In short, inflation remains well above the Fed’s 2.0% target. This leads us to the Fed’s last meeting in mid-June where the Fed left rates unchanged at 5.25% and inexplicably pausing their aggressive hiking cycle for the first time in more than a year despite Chairman Powell’s hawkish post-meeting rhetoric. Sticky core inflation makes it unlikely that we’ll be seeing any meaningful rate cuts this year, a sentiment communicated clearly by Powell, who pointed out in his “Semiannual Monetary Policy Report to the Congress” that “…inflation pressures continue to run high, and the process of getting inflation back down to 2 percent has a long way to go.(emphasis added)”
The primary purpose behind the Fed raising its benchmark interest rates is to dampen inflation, however, raising rates can lead to a multitude of economic issues, including instability in the banking system. Three major banks, First Republic Bank, Signature Bank, and Silicon Valley Bank, all failed in the spring of 2023 partly due to the Fed’s rapid increase in interest rates. This rate hike cycle, much like similar instances in the past, has caused the yield curve to invert meaning long dated treasury securities have lower interest rates than treasuries with shorter durations. For example, on June 21st the spread between the 10-year treasury rate and the 2-year treasury rate was -0.94% (10-year rate lower than 2-year rate) compared 0.08% a year ago and the long-term average of +0.90%. Yield curve inversions are usually a harbinger of an oncoming recession.
While one could argue that the failed banks did not effectively managing risk, the inverted yield curve has severely tightened interest margins and profitability in the banking system as a whole. These three bank failures display just how problematic runaway inflation and destabilizing fast-rising interest rates can be on the financial system. Increased interest rates will inevitably lead to slower economic growth. As the cost of borrowing increases, consumers are less likely to take out loans for big ticket purchases like a home, car or other long-duration assets. Moreover, bank lending becomes more restrictive as the focus of executive leadership shifts to profitability, solvency, and avoiding a run on the bank. This decline in consumption and lending contributes to lower overall economic growth and possibly contractions in economic activity or a recession.
On the asset side of the equation, rapidly rising interest rates will prompt investors to consider more stable, higher yielding investment options like treasury bonds and non-convertible debentures (NCDs). Investments such as treasury bonds and NCDs and other fixed income securities have a greater ability to withstand economic uncertainties and provide greater stability and certainty of investor’s return of principal and income. Fixed income securities offer fixed interest payments which equate to a stable cash yield. For example, 1-year treasury bills currently yield 5.27% compared to 3.15% a year ago. Due to this feature, fixed income securities are generally regarded as safe investment options compared to more volatile stocks and equities. Absent credit defaults, these fixed income yields will remain stable and will not be affected as much by the state of economic conditions and generally offer greater peace of mind should interest rates continue to rise. In addition, if a bond is held to maturity (without being sold), its principal amount (or “Par Value”) is returned. Investment grade fixed income securities are generally highly liquid investments that can be bought and sold easily.
Along with combatting inflation with its interest rate policies, the Fed is keenly focused on the labor market and unemployment statistics. Chairman Powell commented to Congress this week that “The labor market remains very tight. Over the first five months of the year, job gains averaged a robust 314,000 jobs per month. The unemployment rate moved up but remained low in May, at 3.7 percent.”
There are currently 9.9 million job openings in the country and only about 5.8 million unemployed people. Even if all unemployed workers found work, there would still be an overall labor shortage with 4 million jobs needing to be filled. The COVID-19 pandemic is one primary factor in the U.S. labor shortage. During COVID, the number of unemployed workers peaked at over 30 million. Now that COVID has subsided, businesses have re-opened, and workers have reentered the job market. However, some people remain out of the workforce due to pursuing additional education, health issues, taking care of children, or too low wages. In addition, the pandemic has pushed some people into early retirement. It’s estimated that roughly 3 million people were forced into early retirement due to the pandemic. Americans have also been receiving unemployment benefits, stimulus checks, and student loan forgiveness, which provided temporary stability for some of the unemployed workers.
From his foregoing comments, we can see that Chairman Powell is highly focused on the Fed’s dual mandate of promoting stable prices for all Americans as represented by its 2.0% inflation target and maximum employment (consistent with its inflation target). Stock market investors seem to believe that the Fed is nearly done with its interest rate hikes and that the Fed’s aggressive hiking campaign will somehow depart from history and not induce a recession this time around. We believe that with his recent comments the Chairman Powell has communicated that Fed monetary policy is not yet tight enough to bring inflation down some 2.0% to 2.5% to achieve its 2.0% inflation target. Speaking of rhymes, over the past sixty year the only time CPI has dropped by that much has been during or right after the start of a recession. The Fed desperately needs employment to rollover and unemployment levels to rise well above 4.0% to achieve its stable inflation goal. Employment is considered a lagging economic indicator so we would look closely at June employment data issued in mid-July to ascertain whether Fed monetary policies are curtailing production output, employment, and economic activity generally.
To gain a better understanding of how this next Fed-induced recessionary period will playout, it’s essential to compare it with past recessions.
Note: Here is a chart of past recessionary periods alongside Bear Markets.
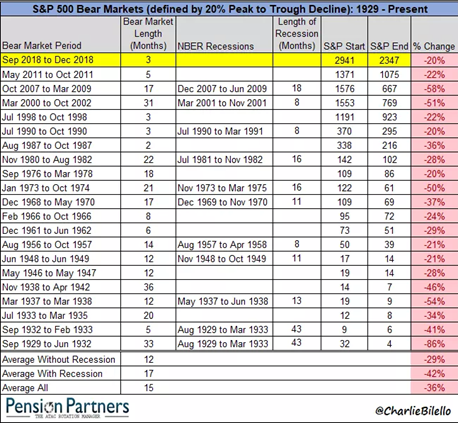
Source: Investopedia
For instance, the Great Depression shares many similarities with our current economic period. Both the Great Depression and our current economy shared banking issues, with some three major banks falling within the past 6 months. During the first phase of the Great Depression, a recession lasting 33 months began one month prior to a 43-month bear market decline of -86%. (That was a very bad nursery rhyme. That’s why we call it Great.) The 1969-1970 recession may also provide valuable insights as to what’s going on with our current economy. Both the 1969 recession and our current economy face high levels of persistent inflation and increased Federal deficits. To address the rising inflation in 1969-1970, the Fed gradually hiked up interest rates to combat inflation. Of note, the bear market decline in stocks of -37% began one year before a 11-month recession started. Similarly, equities declined to bear market conditions in 2022 at the start of Fed’s interest hiking policy, but so far, a recessionary call from the National Bureau of Economic Research (NBER) has not been made. Lastly, our current economic situation shows certain parallels with the Great Recession (2007-2009). Both periods had a key event (the sub-prime mortgage and real estate bubble and COVID-19 Pandemic) that had adverse effects on the U.S. economy. Inflation was an issue during this downturn as well with large price increases in commodities and necessities such as food. A bear market decline of -58% began two months before the 18-month long Great Recession started. During the Great Recession, banks and businesses such as Lehman Brothers failed left and right just like certain businesses today (Silicon Valley Bank). Our current economic conditions have greatly affected small businesses, retail sectors, hotel and leisure, banks, and other businesses. The Great Recession also saw the enaction of a $700 billion bank bailout and a $787 billion stimulus bill. During the COVID pandemic, the U.S. government yet again provided extraordinary deficit spending through various other stimulus bills, as well as a student loan forgiveness plan.
By comparing the current economic period with past recessionary periods, we’re able to clearly generally see that these earlier periods were also marked by severe economic volatility as evidenced by bank and business failures, rising inflation, labor shortages and strikes, and extraordinary government interventions. Recessionary periods are a necessary cleansing of the excesses that have built up over long expansionary periods, whether that be in more speculative investments like venture capital deployed into new, yet unproven technologies and business models, or retail or commercial real estate properties purchased at historically low market cap rates/yields. In both instances, the risk premiums offered provided little or no margin of safety for underwriting errors, economic dislocations, or a doubling in the cost of capital through interest rate hikes.
Financial Market Performance
The current state of the financial markets shows a mixed performance across the various asset classes on a year-to-date basis through mid-June. While the S&P 500 and Dow Jones have experienced marginal negative price returns year to date, the NASDAQ has seen a notable positive return of 24.5% since the start of the year. The breadth of the NASDAQ performance is very narrow with META, AMZN, AAPL, MSFT, GOOGL, TSLA, and NVDA accounting for most of the year-to-date price gains. Bitcoin has displayed impressive gains with a year-to-date return of 63.7%, highlighting its appeal as a speculative, yet scarce asset class. This comes on the heels of a crash in bitcoin and other digital currencies after the FTX and related venture capital-backed scandals emerged in late 2022. Gold has provided a respectable return of 6.7%, reflecting its safe-haven status in times of economic uncertainty. Gold has been consistently seen as a stable store of value over time to which investors allocate more capital to during times of instability due to its real (physical) asset appeal and scarcity of supply. On the other hand, the S&P 500 Bond Index and the S&P 500 Real Estate Sector Index have negative returns of -2.2% and -3.1% which reflect the impact of rising interest rates and potential concerns within the commercial office real estate market. Overall, the high variability between the performance of the various asset classes year-to-date are signaling increased volatility in the real economy and the potentially divergent future paths for the economy and policymaking.
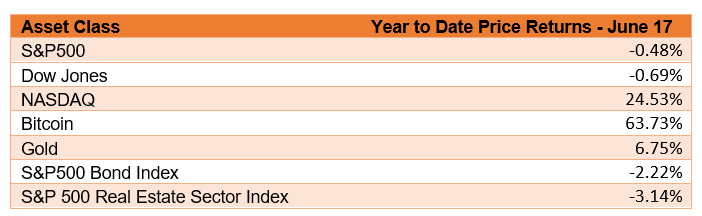
Source: Yahoo Finance https://finance.yahoo.com/
In contemplation of a possible recession, it’s important to discern the safest and most optimal asset classes for investment from a historical perspective. During recessionary periods, certain asset classes have historically performed better than others. For example, as seen on the historical returns data below, gold’s relative volatility, negative correlation to S&P 500, and general outperformance during recessionary periods can be seen clear as day. Another asset class that has historically performed well in recessions is fixed income securities that appreciate in price as interest rates are cut by Fed policymakers to spur the economy out of recession. The performance of certain assets can vary from one recession to another and as they say, “there are no guarantees of future performance.”
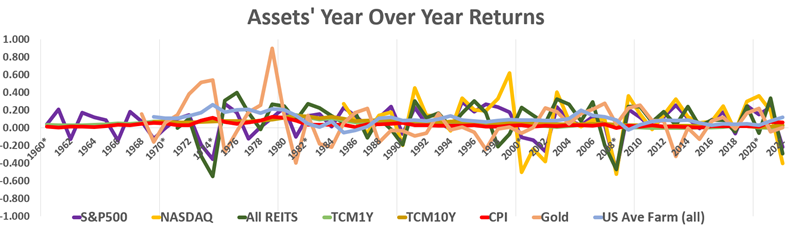
Note: Years marked with * symbolize recessionary periods
Source: TIAA Center for Farmland Research https://farmland.illinois.edu/
Government Bonds: Longer dated government bonds have typically been a great asset class to hold during recessionary periods. In times of economic uncertainty, investors tend to place a high value on the safety and stability of “risk-free” U.S. government bonds. Purchasing a bond essentially equates to you lending money to the government. They then pay you back interest and there’s little to no risk involved in bonds. Note the U.S government retains a very high credit standing among the various credit rating agencies.
Gold: Precious metals such as gold or silver also perform well during recessionary periods because of their intrinsic value and perceived safe-haven status (much like U.S. treasuries). Precious metals are most often used as a hedge against inflation and economic uncertainty. During times of recession, gold has generally increased in value. Between 1973 and 1974, the stock market fell by roughly 25%. At the same time, the price of gold increased by roughly 70%. This trend likely happened due to more gold demand during times of financial instability for its real asset features. Since the demand increased at a faster rate than the supply (gold is a finite resource on earth), the price of gold goes up. This trend also comes up during the 2002 and 2008 recessionary periods. Gold is one of the most volatile assets historically driven by investor risk-on or risk-off mindsets. Gold tends to be one of best performing asset classes during recessionary periods as investors flip to “risk-off” behavior. Macro investors at Crescat Capital believe the macro drivers today support the potential onset of another gold super cycle as depicted in the chart below:
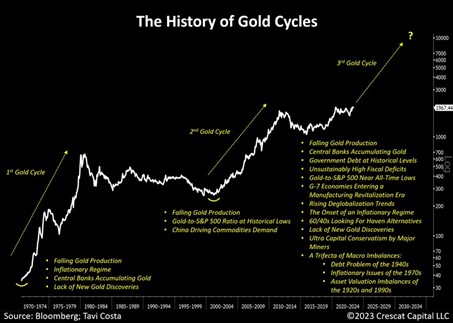
Source: Otavio Costa
Cash: The phrase “Cash is King” couldn’t be truer during recessionary periods. Holding cash, or cash equivalents such as money market funds or short-term government securities, can provide stability and optionality during recessions. The dollar, euro, Swiss Franc, and yen all provide both stability and flexibility. During recessionary periods, highly attractive investment opportunities often arise out of the economic and market turmoil that emerges. Investors with “dry powder” to deploy at the trough of markets typically generate highly attractive risk-adjusted returns.
Farmland: Farmland has historically been an extremely stable and safe investment. It also typically performs well during recessionary periods due to the largely non-discretionary demand for agricultural products. Since farm production is essential for sustaining human life, people are always going to need food, no matter what the state of the economy is. The stable demand for food provides resilience in farmland’s cash flows and appreciation potential. Farmland is also a long-term investment and acts as a steady hedge against inflation. Farmland and farmers get significant government support because of its strategic and political importance. More global governments have been overthrown because of food shortages than any other political factor. Farmland also typically outperforms other assets such as gold or the S&P 500 on a risk-adjusted basis over long periods of time.
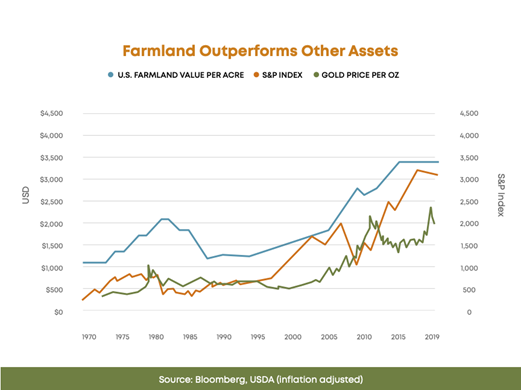
Source: https://farmfolio.net/articles/why-is-farmland-a-smart-recession-proof-investment/
As we reach the halfway mark of 2023, the U.S. economy and investment portfolios face considerable uncertainties amid the potential for a recession. The current economic landscape shows striking similarities to past recessions with warning signs such as rising inflation and the Fed’s aggressive efforts to control it by hiking interest rates as well as labor shortages, government bailouts, bank, venture capital and commercial real estate failures, and other economic turmoil. Due to expectations of increased volatility in economic conditions in this transition from a long expansion period to a potential contraction, we recommend investors seek stability and security in their asset allocations. Asset classes such as treasury bonds, high quality fixed income securities from government and corporate issuers, short-term money market funds and cash equivalents, gold or gold miners, and farmland offer fixed and stable yields, liquidity, and resiliency during periods of economic transition and uncertainties. As we look to the future, we take comfort in knowing it’s not different this time because history rhymes.