Email us at info@servantfinancial.com to talk to a financial advisor today!

Email us at info@servantfinancial.com

Fed Sends Mixed Messages

On September 18th, the Federal Reserve cut interest rates by 50 basis points, marking the beginning of a new rate-cutting cycle. Historically, such a large initial rate cut has typically been reserved for times of economic crisis. Updated economic projections provided by the Fed, referred to as the “dot plots”, indicate that the Fed now anticipates a higher ending 2024 unemployment rate (4.4% vs. 4.1%), higher GDP growth (2.0% vs. 1.4%), lower inflation as measured by the Personal Consumption Expenditure (PCE) index (2.3% vs. 2.4%), and a reduced 2024 year-end Federal Funds rate (4.4% vs. 4.6%) compared to its December 2023 forecasts. These updated forecasts hardly suggest any economic downturn or crisis is around the corner. Both the bond market and the Fed expect an additional 50 basis points in cuts by year-end, implying a 25 basis-point reduction at each of the two remaining Federal Open Market Committee (FOMC) meetings this year.

The Fed’s 50 basis-point cut lacks clear justification based on currently available economic data. Core and headline inflation continue to exceed the Fed’s 2% target, and base effects and housing dynamics suggest that core inflation could remain sticky. Further, on September 26th, the U.S. Bureau of Economic Analysis reported that U.S. GDP grew at an annual rate of 3.0% for the second quarter of 2024. This final 2Q24 GDP figure was revised upward from the initial estimates and reflects healthy economic growth, driven by strong consumer spending, an upturn in private inventory investment, and business investments. Additionally, financial conditions are at their lowest since May 2022, and jobless claims continue to fall. Initial jobless claims in the U.S. fell to 218,000 for the week ended September 21, lower than analyst estimates of 223,000 to 225,000. The latest jobless claims represent a four-month low, indicating a stronger labor market than some analysts and perhaps the Fed anticipated. In addition, the latest Bank of America Fund Manager Survey shows that over 50% of respondents do not foresee a U.S. recession within the next 18 months, i.e.. the consensus expectation remains for a soft landing.

The Fed’s decision to cut interest rates by 50 basis points last week has sent mixed messages to the markets.  The ensemble of market reactions suggests the Fed has ignited risk-on behavior.:

  1. Stock Market: Initially, there was a muted or even negative reaction in the stock market. This might seem counterintuitive because rate cuts are typically viewed as positive for stocks due to lower borrowing costs which can stimulate growth. However, the immediate dip could be attributed to investor concerns that the larger-than-expected cut might indicate the Fed’s worries about underlying economic weaknesses, particularly concerning the labor market. However, following the initial confusion, there has been a meaningfully positive reaction with stocks rallying sharply as market consensus moves toward the assessment that the Fed does not have any inside information on data portending broad economic weakness.
  2. Bond Market: The bond market showed a significant and immediate reaction with the 10-year Treasury yield spiking to 3.78% on September 26th from 3.64% the day before the Fed’s rate cut. The bond market seems to be repricing for higher expected inflation and/or stronger economic growth in the longer term post the Fed’s cut.
  3. Gold: Gold spiked to an all-time high on September 26th by topping $2,700 per ounce for the first time in history. This signals both the possibility of a Fed dovish policy mistake and safe haven buying in response to the escalation of the wars in Ukraine and the Middle East.
  4. Bitcoin: Likewise, bitcoin, or digital gold, has popped above $65,000 and is up almost 4% on the 26th.  For market technicians, the $65,000 price per bitcoin represents a key technical level with many analysts suggesting that a breakthrough of this level may signal the beginning of another epic run. Today’s price appreciation may signal the start of a run to Bitcoin’s all-time high, previously set in November 2021 at approximately $69,000.  Pop zing!
  5. Energy Markets:
    1. Oil: Oil prices have shown limited volatility as of late. Brent crude has been range-bound around $75 per barrel. There’s some underlying sentiment of a bear market in oil, with some hopes pinned on-demand increases or external stimuli like actions from China to boost prices.  Escalation of the Middle East war between Israel and Iran’s Hezbollah proxy in Lebanon could drive increased risk premiums into oil prices.
    2. Natural Gas: Natural gas experienced a significant jump, with futures up over 8% recently, possibly due to the aforementioned geopolitical tensions in the Middle East or expectations of increased demand from electricity producers looking for energy resources to satisfy the growing demand for Artificial Intelligence computing capacity.
    3. Uranium: Uranium has seen quite dramatic swings in prices in 2024.  The spot price of uranium has decreased by (11.6%) since the beginning of 2024, reaching around $80 per pound as of late September, after hitting a 16-year high earlier in the year due to increased demand and tight supply.   Despite this year-to-date decrease, uranium has been the best-performing energy commodity year-over-year, despite its decline from a peak of $106 in February 2024.  The supply-demand imbalances in uranium are long-term in nature as it takes around a decade to bring new supply online.  As we’ve outlined previously, there is strong interest in uranium due to its role in nuclear power production, especially with global pushes towards decarbonization and the “greening” of nuclear energy. Uranium prices and Sprott Uranium Miners ETF (URNM) have been raging as of late. URNM is up about 13% since the last FOMC meeting.

X Grok AI rendering of Three Mile Island nuclear plant


Last week, BlackRock, Global Infrastructure Partners, Microsoft, and MGX announced an AI partnership that could invest up to $100 billion in U.S. energy infrastructure and data centers. Additionally, Constellation Energy signed its largest-ever power purchase agreement with Microsoft, adding 835 megawatts of carbon-free, nuclear energy to the grid. Microsoft’s long-term offtake commitment catalyzed the restart of the decommissioned Three Mile Island nuclear plant in Pennsylvania, with key permits still required.  The deal is projected to contribute $16 billion to Pennsylvania’s GDP and generate over $3 billion in taxes.

Prince fans will remember an analogous Fed policy instance that occurred in 1999.  At the December 21, 1999, FOMC meeting, the Fed kept interest rates unchanged, citing uncertainties around the century date change across the nation’s information processing systems. Nearly a year later, in January 2001, the Fed began cutting rates, starting with a 50 basis-point reduction due to weakening production, declining consumer confidence, tightening financial conditions, and high energy prices.   At that time, jobless claims and headline inflation were higher than today.  Core inflation and manufacturing activity were lower. The price-to-earnings (P/E) ratio of the S&P 500 was 30.1x, compared to 27.5x today. However, the technology sector’s price-to-sales ratio is currently over 30% higher than it was during the peak of the 2000 Tech Bubble.  The top 10 companies in the S&P 500 now make up 34% of this large-cap index, compared to 25% at the height of the Tech Bubble.

Servant Financial’s market commentary and portfolio recommendations for this 1999-like party atmosphere are as follows.  S&P 500 valuations appear rich using metrics like the Shiller P/E ratio.  Further, yield-to-earnings comparison (the inverse of the P/E ratio versus bond yields) suggests U.S. stocks are less attractively priced relative to bonds than at any time since the 1990s and are reminiscent of conditions before the dot-com bubble. For now, looser financial conditions introduced by the Fed (characterized by lower interest rates, higher liquidity, and easier credit) may end up keeping the ‘party’ going for some time, but no one knows for sure. We will continue to keep a watchful eye on the adults (10-year Treasury yield and gold) and the underage, yet savvy teenager (bitcoin) for messages and clues that things are getting out of hand and it’s time to leave the party. We’ll also keep an eye on inflation rates, shifts in Fed policy guidance, or significant geopolitical events that could also serve as catalysts for a change in market dynamics.

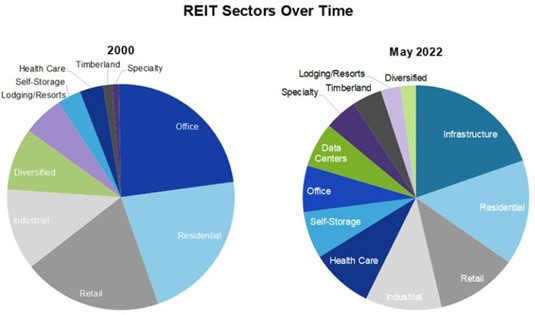
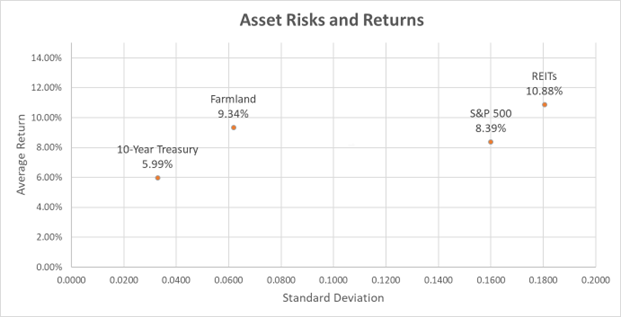
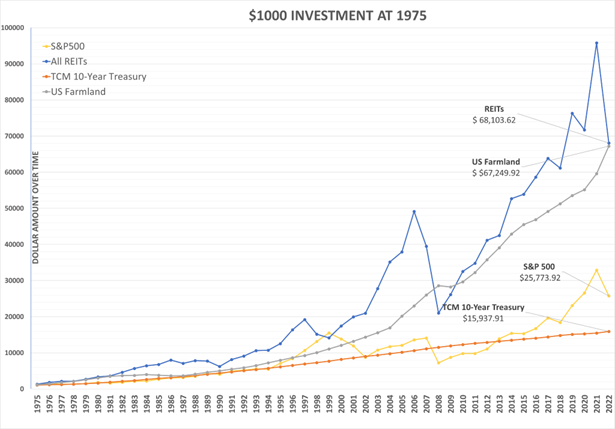
In light of these economic uncertainties, we believe it’s prudent for investors to continue to maintain globally diversified portfolios. Globally diversified portfolios are comprised of traditional investments in stocks and bonds but importantly also include diversifying assets like gold, silver, shares in gold miners, bitcoin, and real assets such as uranium and farmland. These assets offer a hedge against inflation, and currency fluctuations, and provide portfolio stability during periods of market volatility.


Inflation Conundrum: How to Protect Your Portfolio

Stock Market and Inflation Trends

Stock indexes have continued their bull run in July ahead of the much-anticipated June Consumer Price Index (CPI) report. On July 10th, the S&P 500 and the Nasdaq Composite both closed at record highs, marking their seventh consecutive session of gains in July. The Dow Jones Industrial Average ended just shy of its own record close. Through July 10th, the S&P 500 was up 3% for the month, while the tech-heavy Nasdaq surged 4.9%, and the Dow added 1.4%

The continuation of risk-on attitudes were encouraged by Fed Chairman Powell’s July 9th comments in Congressional testimony before the Senate Banking Committee.  Powell expressed caution about cutting interest rates, stating that the data does not yet support full confidence in the inflation path needed for a rate cut. He emphasized the need for more positive economic indicators to boost his confidence on the future path of inflation. Powell also warned that maintaining high interest rates for too long could negatively impact economic growth.  On the other hand, he commented that prematurely easing monetary policy or easing too much could harm the Fed’s progress in taming inflation.

The Federal Reserve remains focused on achieving its 2% inflation target and is closely monitoring labor market conditions, which have shown recent signs of cooling but remain relatively robust.  If you recall, May CPI came in much cooler than expected, which went a long way in restoring Wall Street’s faith that expected Federal Reserve rate cuts would happen in 2024.

The June Consumer Price Index (CPI) was reported on the morning of July 11th, and it did not disappoint. CPI for all items decreased by (0.1%) in June 2024, which was below expectations of a 0.1% increase. This is the first negative month-over-month inflation print since May 2020. Year-over-year headline inflation for June of 3.0% now sits at a 12-month low.  Core CPI, which removes more volatile energy and food prices, increased 3.3% from a year ago.

In response to the June CPI print, bond traders have increased the odds of a Fed rate cut by September 2024 to 83% from 67% odds before the deflationary June CPI inflation print.  Exactly one year ago, the Fed stopped raising interest rates.  Despite market and Fed expectations for at least one interest rate cut this year, U.S. inflation remains 100 basis points above the Fed’s 2% inflation mandate.

The next inflation update is the June PCE Prices Index on July 26, which is Fed’s favored inflation indicator. Additionally, there are two more CPI prints and one more PCE Price read due out before the Fed’s next meeting in September.

Bull vs. Bear

Bullish and bearish investors immediately began battling it out after the June CPI print as to whether inflation has been tamed by the Federal Reserve or not.  Mastering of inflation is generally considered bullish for both bond and stock markets.  Alternatively, the starting of a Fed easing cycle without putting a lid on inflation is considered bearish to both markets.  The worst-case economic scenario is stagflation where we experience slowing economic growth, but inflationary pressures remain.

Risk capital began making its bets on July 11th right away as capital made meaningful rotations by asset classes, equity market capitalization and sector, and geography.

Here is a heat map for the trading day for popular, domestic Exchange Traded Funds (ETFs):

Bond ETFs (AGG, +0.5%, LQD +0.5%, JNK +0.4%) as expected all responded positively to the deflationary CPI print. While the top-performing major equity benchmark was interest rate-sensitive small caps (IWM, +3.7%) on the day. Capital-hungry small caps have substantially lagged the S&P 500 (SPY, -0.9%) on a year-to-date basis by over 10%.    The technology-heavy NASDAQ (QQQ, -2.2%) was the worst performer on the day along with the S&P 500 Technology sector (XLK, -2.5%) as investors booked profits and/or took some chips off the Magnificent 7 table.  Interest rate-sensitive sectors within the S&P 500 had meaningful bounces with Real Estate (XLRE, +2.7%) and Utilities (XLU, +1.8%) the top performers.

It’s also worth noting that traditional inflation hedges like precious and industrial metals also did well with gold (GLD, +1.7%) and S&P Materials sector (XLB, +1.4%).  The U.S. Dollar Index (DX-Y.NYB, -0.6%) traded lower against a basket of the other global fiat currencies.   Fidelity Wise Origin Bitcoin Fund (FBTC, +0.1%) was flat, but China (FXI, 2.2%) was the top-performing international market on the day as the dollar weakness acts as a for sale sign on Chinese goods on international markets.

Relative to the S&P 500 decline on the day, noteworthy contributors to Servant Financial client models were Farmland Partners (FPI, +3.2%), gold miners (GDX, +2.8%), Sprott Physical Gold and Silver Trust (CEF, +2.0%), silver (SLV, 1.9%), high quality value-oriented large caps (DSTL +1.6%, BRK.B +1.2%, MOAT +1.1%) and uranium (URNM, 1.3%).

Protecting Your Portfolio

Inflation has remained stubbornly above 3% and well above the Federal Reserve’s official 2% policy target for more than three years.  Over this period, the traditional 60%/40% (equities/fixed income) portfolio has struggled and may no longer be an appropriate default investment approach going forward.

The risks of continued persistent inflation above the Fed’s target inflation of 2% are considerable.  The Federal Reserve is expected to begin an easing cycle at a time when the fiscal situation remains nothing short of precarious.  As witnessed in the recent Presidential debate and in the discourse that followed, there is a complete lack of fiscal restraint being expressed by political leaders on either side of the aisle.  The Congressional Budget Office recently estimated that the fiscal budget deficit was estimated at $1.9 trillion, or 7% of U.S. GDP, for the year ended June 30, 2024.  The last time the deficit was this high as a percentage of GDP was during World War II.

Just to cite one conundrum reflecting Washington’s inability to responsibly govern, the Federation for American Immigration Reform testified before the House Budget Committee that American taxpayers pay $151 billion annually due to illegal immigration.   The CBO estimated 2024 deficit of $1.9 trillion apparently does not fully account for the cost of illegal immigration at the state and local level or include discretionary costs and long-term entitlement costs associated with illegal immigration.

The prospects for a traditional 60/40 portfolio in a future resplendent with high and sustained inflation are worrying, particularly if inflation is like that experienced in the 1970s and early ‘80s stagflationary period. Servant Financial believes broadly diversified portfolios require a healthy allocation to inflation-protected assets like gold and precious metals, bitcoin (“digital gold”), real estate, high-quality large-cap equities, energy, and raw materials to weather any potential economic disturbances ahead.  Specifically, Servant Core portfolio allocations to Real Assets, Infrastructure (energy), and Digital Assets range from approximately 9% for the most conservative client risk profiles to 25% for the most aggressive risk profiles. We also run a bespoke “best ideas” portfolio that has substantially all its assets invested in Real Assets, Infrastructure, and Digital Assets.

We close this article with a wise quote from another period of war, irresponsible governance, and economic injustice for the working class and poor in our nation.

“In this unfolding conundrum of life and history, there is such a thing as being too late. Procrastination is still the thief of time. Life often leaves us standing bare, naked, and dejected with a lost opportunity.  The tide in the affairs of men does not remain at flood — it ebbs. We may cry out desperately for time to pause in her passage, but time is adamant to every plea and rushes on. Over the bleached bones and jumbled residues of numerous civilizations are written the pathetic words, “Too late.””

~ Martin Luther King, Jr., Beyond Vietnam — A Time to Break Silence

Delivered 4 April 1967, Riverside Church, New York City

Hike Spike: Navigating REIT Sector Amidst Soaring Interest Rates

Introduction

Since March of 2022, the Federal Reserve has lifted its benchmark interest rate 11 times and held rates steady only twice at its regularly scheduled meetings, including this past September’s pause.  With the Federal Reserve’s interest rate hiking campaign seemingly nearing an end at a 22 year high for the Federal Funds Rate of 5.25% to 5.50%, we thought we’d take a fresh look at the Real Estate Investment Trusts (REITs) sector.  REITs have become a more common investment choice for investors looking to diversify their portfolios from traditional 60%/40% stock and bond portfolios. A REIT is a company that owns or operates real estate. The real estate owned ranges widely from office buildings, shopping malls, and hotels to warehouses, data centers, and storage facilities. REITs are attractive to investors because they provide efficient and liquid access to real estate investing without requiring actual ownership or management of real estate properties. REIT companies allow investors to purchase minority interests in their real estate portfolios and essentially hire the executive team and employees to manage the properties on their behalf. REIT investors typically receive consistent and strong dividend payments, share price appreciation, tax benefits, and a hedge against inflation. REITs can avoid double taxation through dividend-paid deductions. REIT companies are required to distribute at least 90% of their taxable income to shareholders through dividends for the REIT to avoid corporate-level taxation. This structure allows investors to receive real estate income without the burden of double taxation.  In other words, REIT investors should receive higher dividend distributions than under a corporate-level taxation regime.


Types of REITs

REITs come in various types and specialize in many different types of properties. According to NAREIT data, the predominant categories of REITs today include Infrastructure and Industrial, Residential, Retail, Healthcare, and Office.

The chart below summarizes the comparative REIT components from 2000 and May of last year and highlights the changes in the largest real estate asset classes over time:

Source: National Association of Real Estate Investment Trusts (NAREIT)


Infrastructure and Industrial:  Infrastructure REITs own and manage infrastructure real estate and collect rent from tenants that occupy that real estate. Infrastructure REITs’ property types include fiber cables, wireless infrastructure, telecommunications towers, and energy pipelines.  Industrial REITs own and manage industrial facilities and rent space in those properties to tenants. Some industrial REITs focus on specific types of properties, such as warehouses and distribution centers. Industrial REITs play an important part in e-commerce and are helping to meet the rapid delivery demand.  We’ve grouped these together since one type is essential a network for transferring information while the other is a network for transferring goods.  These REIT sectors are a growing part of today’s modern economy.

Residential: Residential REITs or Multifamily REITs invest in manufactured housing and apartment buildings. They both offer affordable alternatives to home ownership which satisfies a seemingly never-ending demand for younger Americans just entering the workforce.  Affordable housing is another non-discretionary item and there will always be a base level of demand. Residential REITs succeed the most when they invest in areas where home costs are too expensive or impractical and centrally located apartments are in high demand. Cities such as Chicago and New York are prime residential REIT investment examples. If there is consistent demand for apartments over homeownership, Residential REITs will find success.

Retail: Retail REITs invest in shopping malls, strip malls, and other retail outlets. Revenue is received from monthly rent payments from retail tenants.  This leasing aspect makes it important for Retail REITs to try and pick optimal store tenant mix and locations that maximize the amount of foot traffic to their retail properties. Amazon is making it increasingly difficult for most traditional retail department stores to remain profitable and in business.  Think of Sears and K-mart.  Retail REITs need to invest wisely in properties and tenants that are less impacted by online shopping. This includes high-traffic areas such as urban malls, popular tourist shopping areas, and necessity-based or non-discretionary stores for frequent recurring purchases (convenience stores, pharmacies, grocery stores, etc.). Areas that REIT companies tend to shy away from are areas with high vacancy rates, lack of accessibility either pedestrian or car traffic, and areas of economic decline and high crime rates.  For example, Target made headlines this past week with their announcement to close nine stores across four states because of theft and crime.  The Minneapolis-based company will close locations in the Harlem neighborhood of New York City, Seattle, Portland and the San Francisco Bay Area effective Oct. 21.

Healthcare: Healthcare REITs invest in hospitals, clinics, retirement homes, and skilled nursing facilities. Again, given favorable U.S. demographics, particularly an aging Baby-Boomer generation, there is going to be consistent demand for healthcare services which brings stability and success for Healthcare REITs that own the real estate assets leased to retirement home and skilled nursing providers. Increased demand for healthcare, such as with the COVID-19 pandemic, may lead to better performance for Healthcare REITs with variable rent components based on sales. In addition, life expectancies continue to increase which means the older population keeps growing. Since older people require more healthcare and nursing/retirement home services, there is an overall increase in demand for healthcare which has boosted the performance of Healthcare REITs in recent years.

Office: Office REITs invest in office buildings and collect monthly rental income from tenants. These tenants are generally businesses and companies with centrally located offices to drive employee collaboration. As more and more companies are introducing remote work environments, office vacancy rates have increased in recent years which has put significant pressure on the Office REIT sector. Office vacancy rates have climbed across all of the major U.S. cities, led by San Francisco’s increased vacancy rate of nearly 20%.  The Visual Capitalist stated that it is anticipated that by 2030, over 300 million square feet of U.S. office spaces will be obsolete. Other factors such as the unemployment rate and economic performance can also directly affect the performance of Office REITs.


REIT Yields and Comparison to Farmland

REITs have traditionally provided investors with consistent dividend income and appreciation potential. The amount and variability of rental income depends on the type of REIT and the overall sector performance at the given time.  We’ve tried to highlight the differences in REIT income sources above between those that a predominantly non-discretionary in nature like Residential REITs and those REITs with higher variability in rental streams like Office and Retail REITs.

Using data compiled from the TIAA Center for Farmland Research, we’ve compiled performance data below for REITs, farmland, 10-year U.S. treasury, and the S&P 500 for the last nearly 50-year period (since 1975).  REITs (averaged from all types) average annual total return of 10.88% per year while farmland provided an average annual return of 9.34% nationally. While REITs offered the highest annualized return over this period, it was also the most volatile of the four assets as measured by the standard deviation of its returns at 18%.  REIT volatility surpassed the S&P 500 of 16%.  Farmland outperformed all of the other asset classes on a risk-adjusted basis with its annual return of 9.34% but with only a third of the volatility of REITs at 6%.

The performance of most REIT sectors are more variable than farmland depending on economic factors such as interest rate fluctuations and supply and demand changes. REITs are considered an interest rate sensitive asset class much like the utility sector. For example, the largest REIT ETF is Vanguard REIT Index (VNQ). VNQ’s year-to-date returns through August 2023 are measly 1.9% total return with a one-year annualized loss of -7.3% and two-year loss of -9.7%. On the other hand, farmland has generally continued to appreciate in 2022 and 2023 based on the favorable trends in farming income. Farmland stability comes from the constant need for food and the fact that it’s uncorrelated with other asset classes, but highly correlated with inflation as measured by the Consumer Price Index (CPI).

Source: https://farmland.illinois.edu/research-briefs/


As the chart depict below, REITs have still given farmland a run for their money albeit with more volatility producing a value of $68k for $1k investment in 1975.  Farmland was a close second at $67k outcome for your $1k. However, the stability of farmland returns is noticeable from the chart.  Farmland generates income from agricultural activities which have relatively lower capital expenditures and income potential compared to income-generating properties like multifamily apartments or commercial office buildings. REITs will have much more capital expenditures for repair and maintenance of building structures whereas farms are mostly land with farm structures generally approximating 5% to 10% of the value of the farmland. Investors generally require higher yields from REITs because of the higher Capex requirements and the higher risk of obsolescence.  Think Office REITs and some Retail locations and business models. In theory, investors should therefor require a lower risk premium for farmland given its lower volatility as compared to REITs, but there is limited available data to support this assertion.

This graph shows the growth of a $1000 investment in 1975 over time. If you invested $1000 into each of these 4 asset classes, you would get the most return out of REITs and farmland.

Source: https://farmland.illinois.edu/research-briefs/


The State of REITs

Servant Financial’s institutional investment research partner SpringTide Partners recently conducted a review of state of interest rate sensitive real estate sector considering the Fed’s hike spike in interest rates.  SpringTide examined REITs, midstream energy, and S&P 500 earnings yields (E/P, or cap rate) to 2-year and 10-year U.S. Treasury yields.  Below is a chart of the spread between these earnings yields and the 2-year treasuries.    You’ll note that for REITs the current yield spread is roughly -2.5%. This spread to 2-years hasn’t been this negative previously until just prior to the 2008-9 global recessionary period and the Global Financial Crisis. In that era of Fed policy mismanagement, REITs yield spreads blew out almost 7.5 percentage points from -2.5% in 2007 to just shy of 5.0% in 2009.  This graph also demonstrates the yield spread of REITs compared to other asset yields.  You’ll also note that yield spread to 10-year treasuries and S&P 500 is also negative for the first time since 2007.  In other words, investors are not receiving a risk premium over 2-year treasuries for investing in either REITs, long-term treasuries (no term premium), and S&P 500.   This analysis suggests investors would currently be better off putting money into a savings account rather than REITs, 10-year treasuries, or the S&P 500.

Source: https://springtide-partners.com/


This chart below demonstrates that the historical entry/purchase cap rates for REITs are a key determinant of an investor’s exit net multiples. The cap rate is computed as the net operating income of a REIT divided by the purchase price at time of entry. Higher cap rates suggest higher risk at the time of purchase and increased risk premiums relative to risk-free treasuries. REITs today are trading at 6.4% cap rate, or earnings yield.  According to this chart, investors who buy REITs at the current 6.4% cap rate would be lucky to break even much like where the 2015-post-COVID cycle investors who bought in.  Alternatively, the historical sweet spot to invest in REITs was in the early 1990s and the pre- and post-Dot.com bust of the late 1990s and early 2000s when entry cap rates were roughly 9.5% compared to today’s 6.4%.


Source: https://springtide-partners.com/


Conclusion

REITs have gained popularity amongst investors for their portfolio diversification benefits. They offer exposure to a range of real estate sectors and risk profiles, such as retail, residential, healthcare, office, and infrastructure/industrial. While REITs have provided historically attractive average annual returns since 1975, other investment options, such as short-term U.S. treasuries, money market funds, farmland, or high-yield bonds, look more attractive on a risk-adjusted basis in our current economic state. High-interest rates are drastically affecting the performance of REITs, particularly those REITs with higher leverage, interest rate risk, and near-term refinancing exposures. Our recommendation is that REIT investors remain patient and await the Fed’s “hike spike” to work its way into REIT entry cap rates.  Based upon recent history, a move in REIT yield spreas over 2-year treasuries of 2.5% to 5.0% seems “real”-istic.

white-arrow